Ad-hoc data visualization using Claude + MotherDuck + mviz
Ad-hoc analytics using Claude Code, MotherDuck and mviz to create visualizations


The most valuable analysis is almost always point-in-time, deeply contextual, and effectively disposable once a decision is made. Building a dashboard is not necessarily efficient in that case, no matter how appealing it may be.
The smart folks at MotherDuck (MD) recently (December 2025) released their remote MCP server (in addition to their local MCP server) which makes it even more easy to interact with MD using any MCP client. And even more recently (January 2026) Jacob Matson (and potentially some co-conspirators not yet visible in the GitHub repo) dropped mviz: A skill for Claude to generate visualizations for ad hoc analysis. However, this is (as far as I can tell) fairly unrelated to MD - other than Jacob working there of course 🤔
Enough reason for me to explore ad-hoc analytics using Claude Code and MD, so here we go...
Prerequisites
I use the Claude Code extension in VSCode on Windows, so I need:
- the VSCode extension including the CLI installed
- the CLI in my system environment's PATH (testable by
claude --version) - install mviz (or use npx instead, but Claude Code might need to be instructed to do this)
Connecting Claude to MD
With the new remote MCP server the connection to MD doesn't require a MD token anymore. Instead, I first added the remote MCP server to Claude (or actually: replaced the previous local MCP server) using my terminal:
claude mcp add MotherDuck --transport http https://api.motherduck.com/mcp --scope user
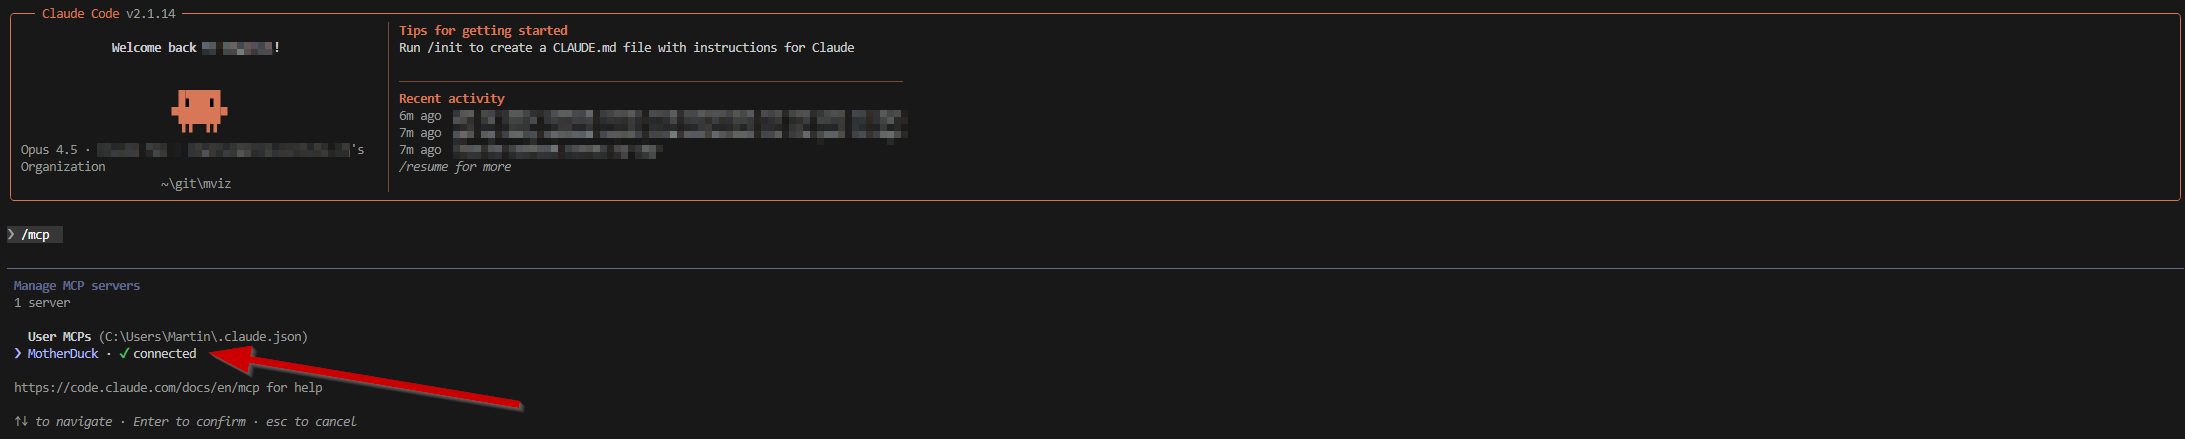
I use the user scope here because I want to use the MCP in multiple VSCode workspaces. Next, just following the quick start, I run Claude in the CLI: claude
And then /mcp to select and authenticate the new MotherDuck MCP on the list.
Chatting
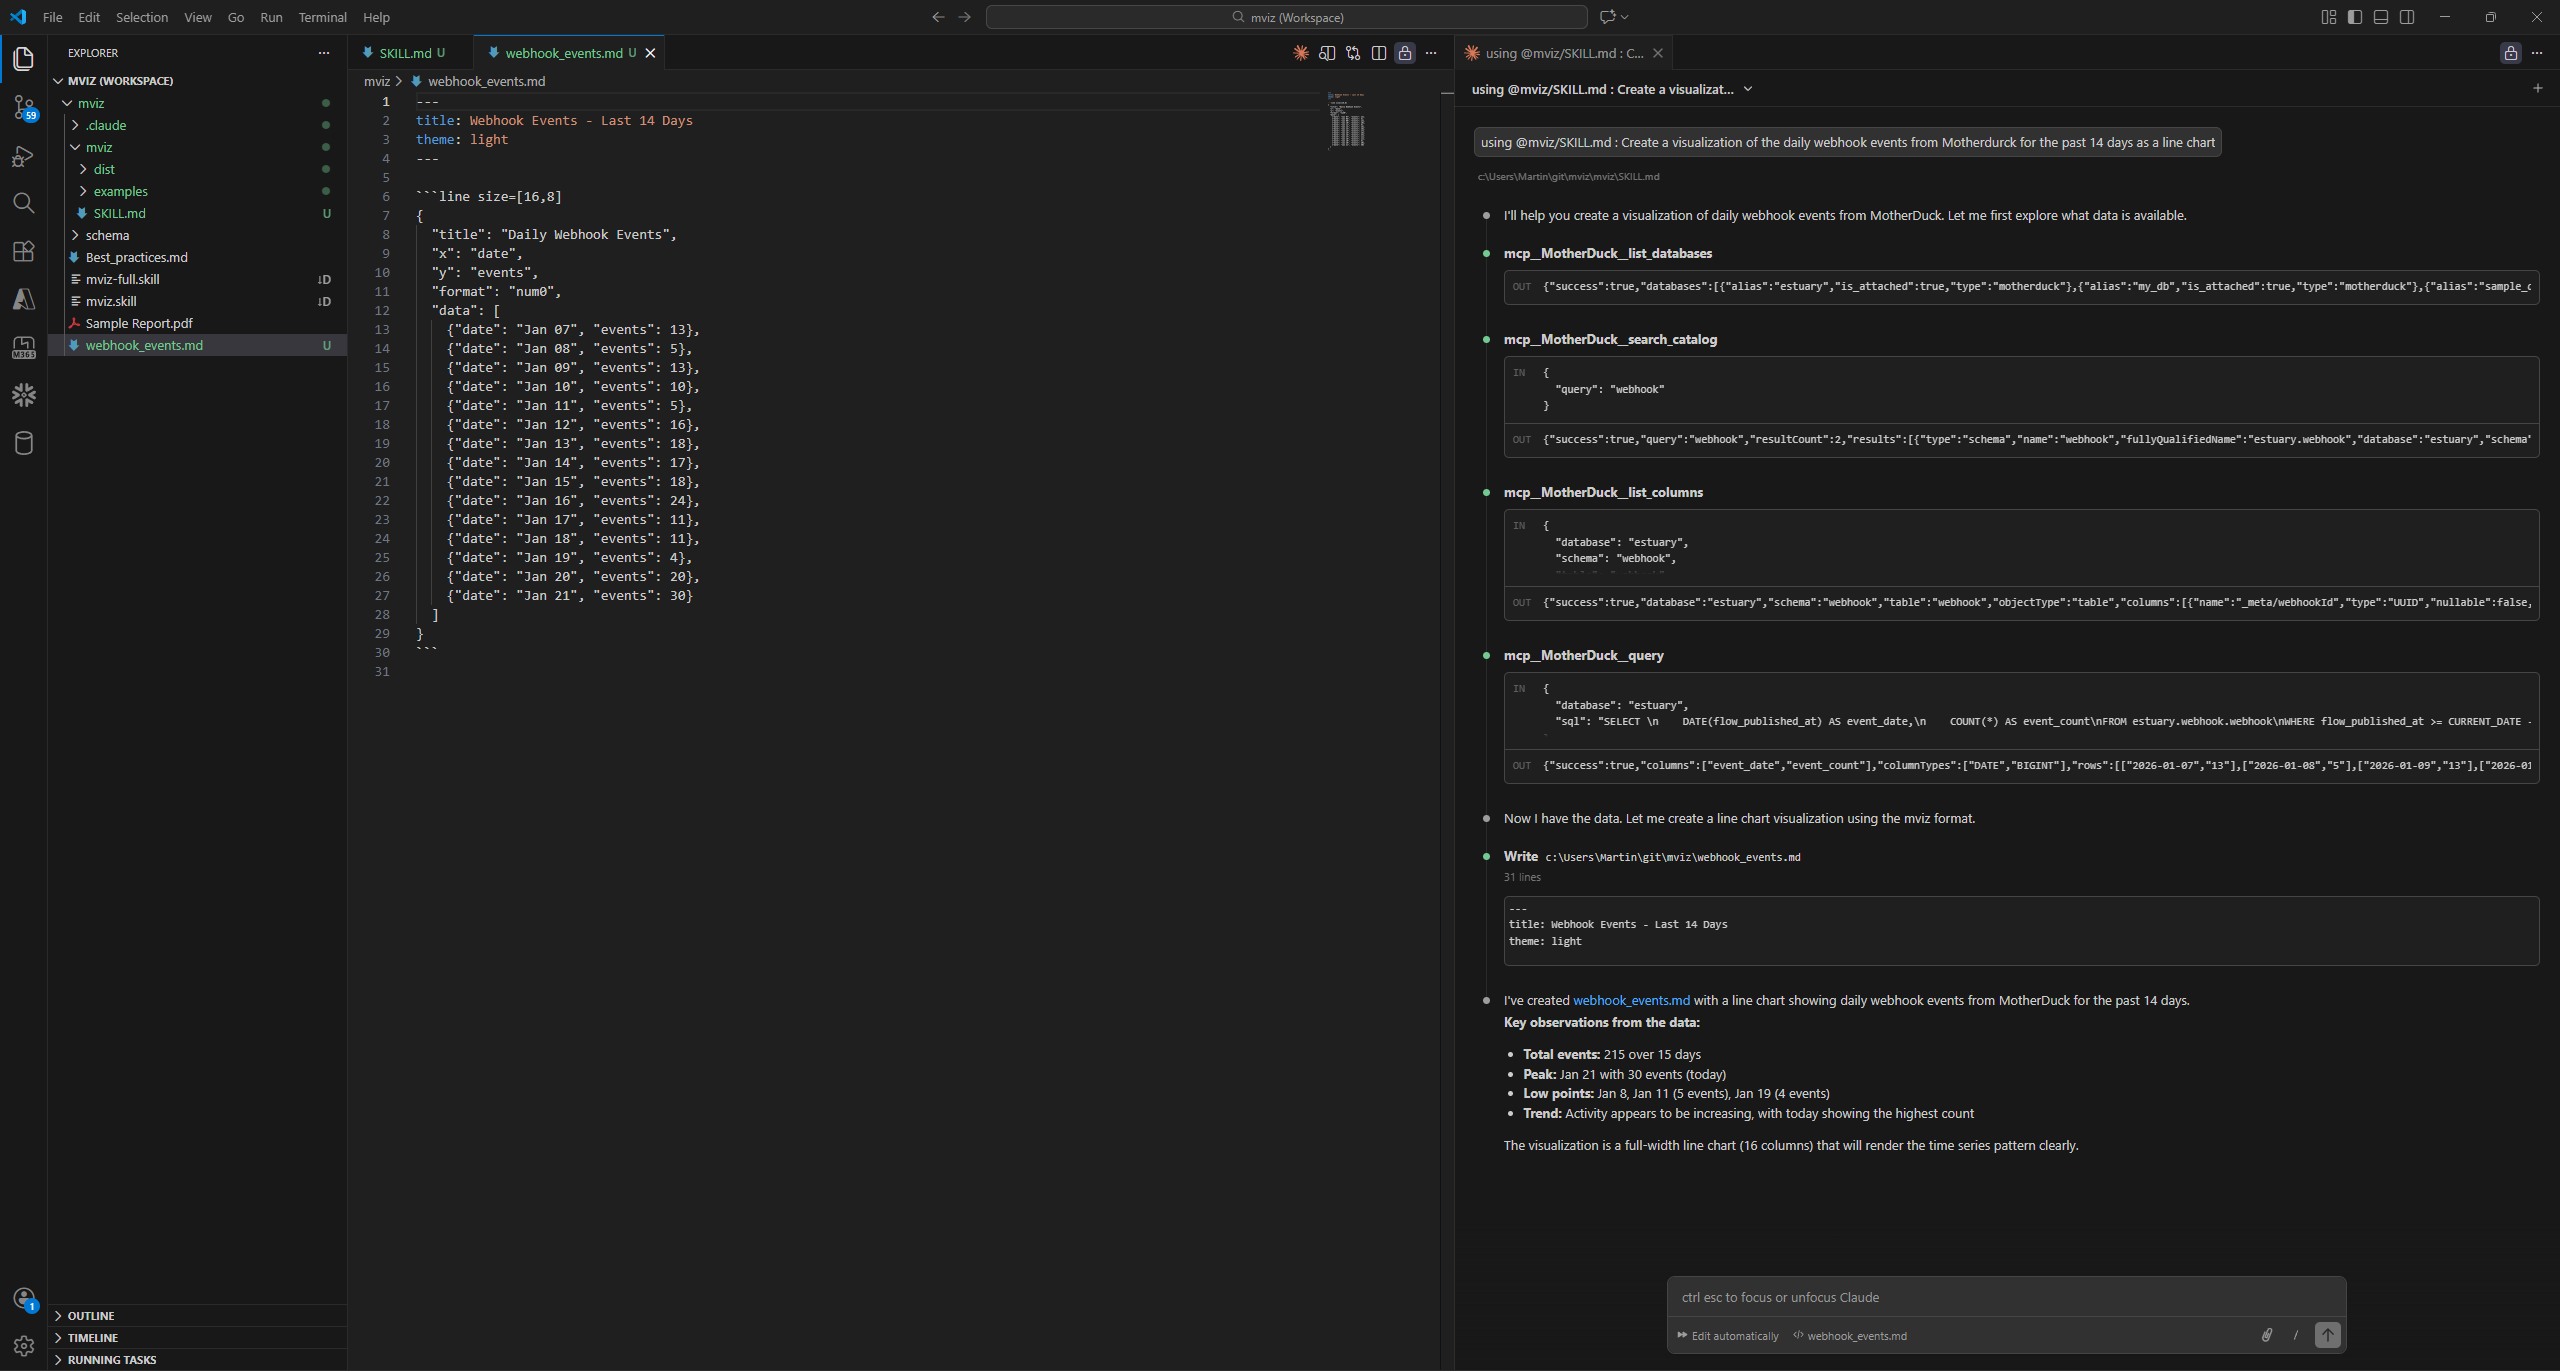
After restarting VSCode (so the VSCode extension picks up the new Claude config) I asked Claude Code to "Get daily webhook events from MotherDuck for the past 14 days" - the question obviously contains a little bit of context, but definitely not very much.
This is how the underlying data looks like in MD:
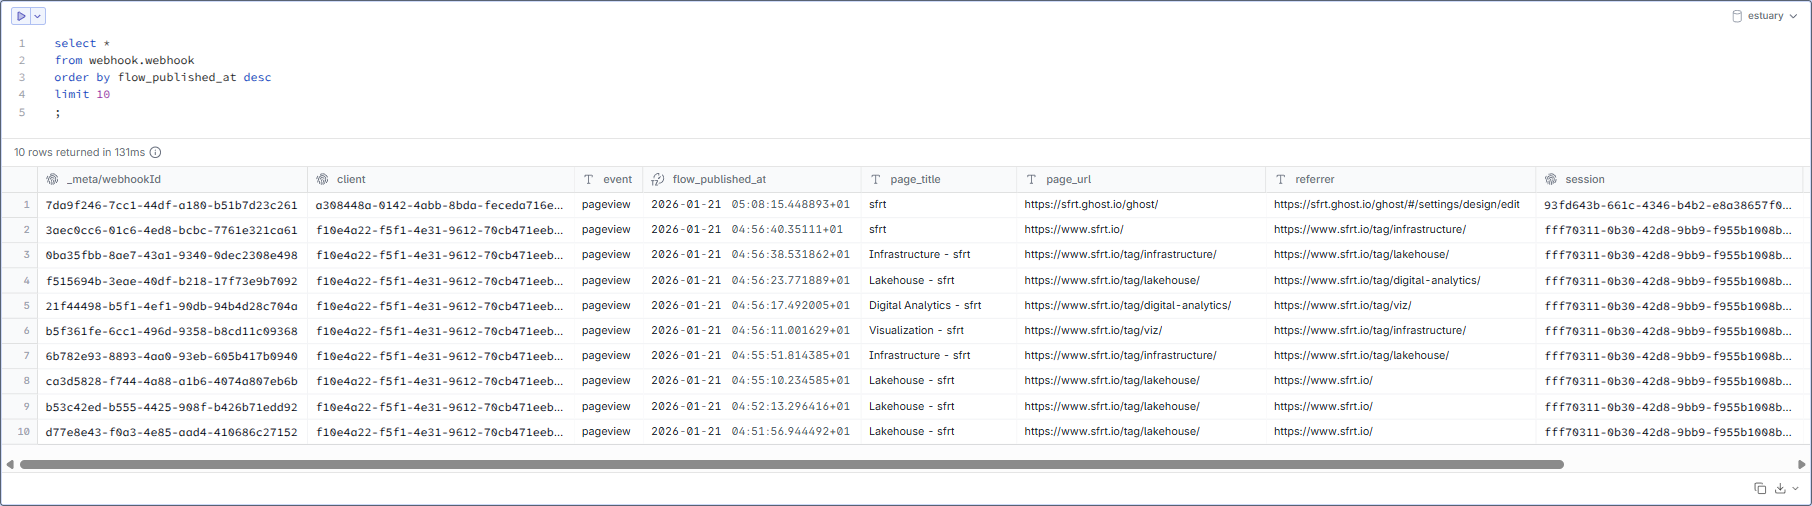
So by asking the above question, Claude (using the MCP) would have to identify the correct table (in the correct schema in the correct catalog), generate a query and return a table. Still, every time I ask Claude to do something like this, I am astonished how well this works in DuckDB/MD without any additional semantic information. It doesn't find the correct data every time on the first attempt, sure, but it surprisingly often does 😎
And this is what Claude did with my question:
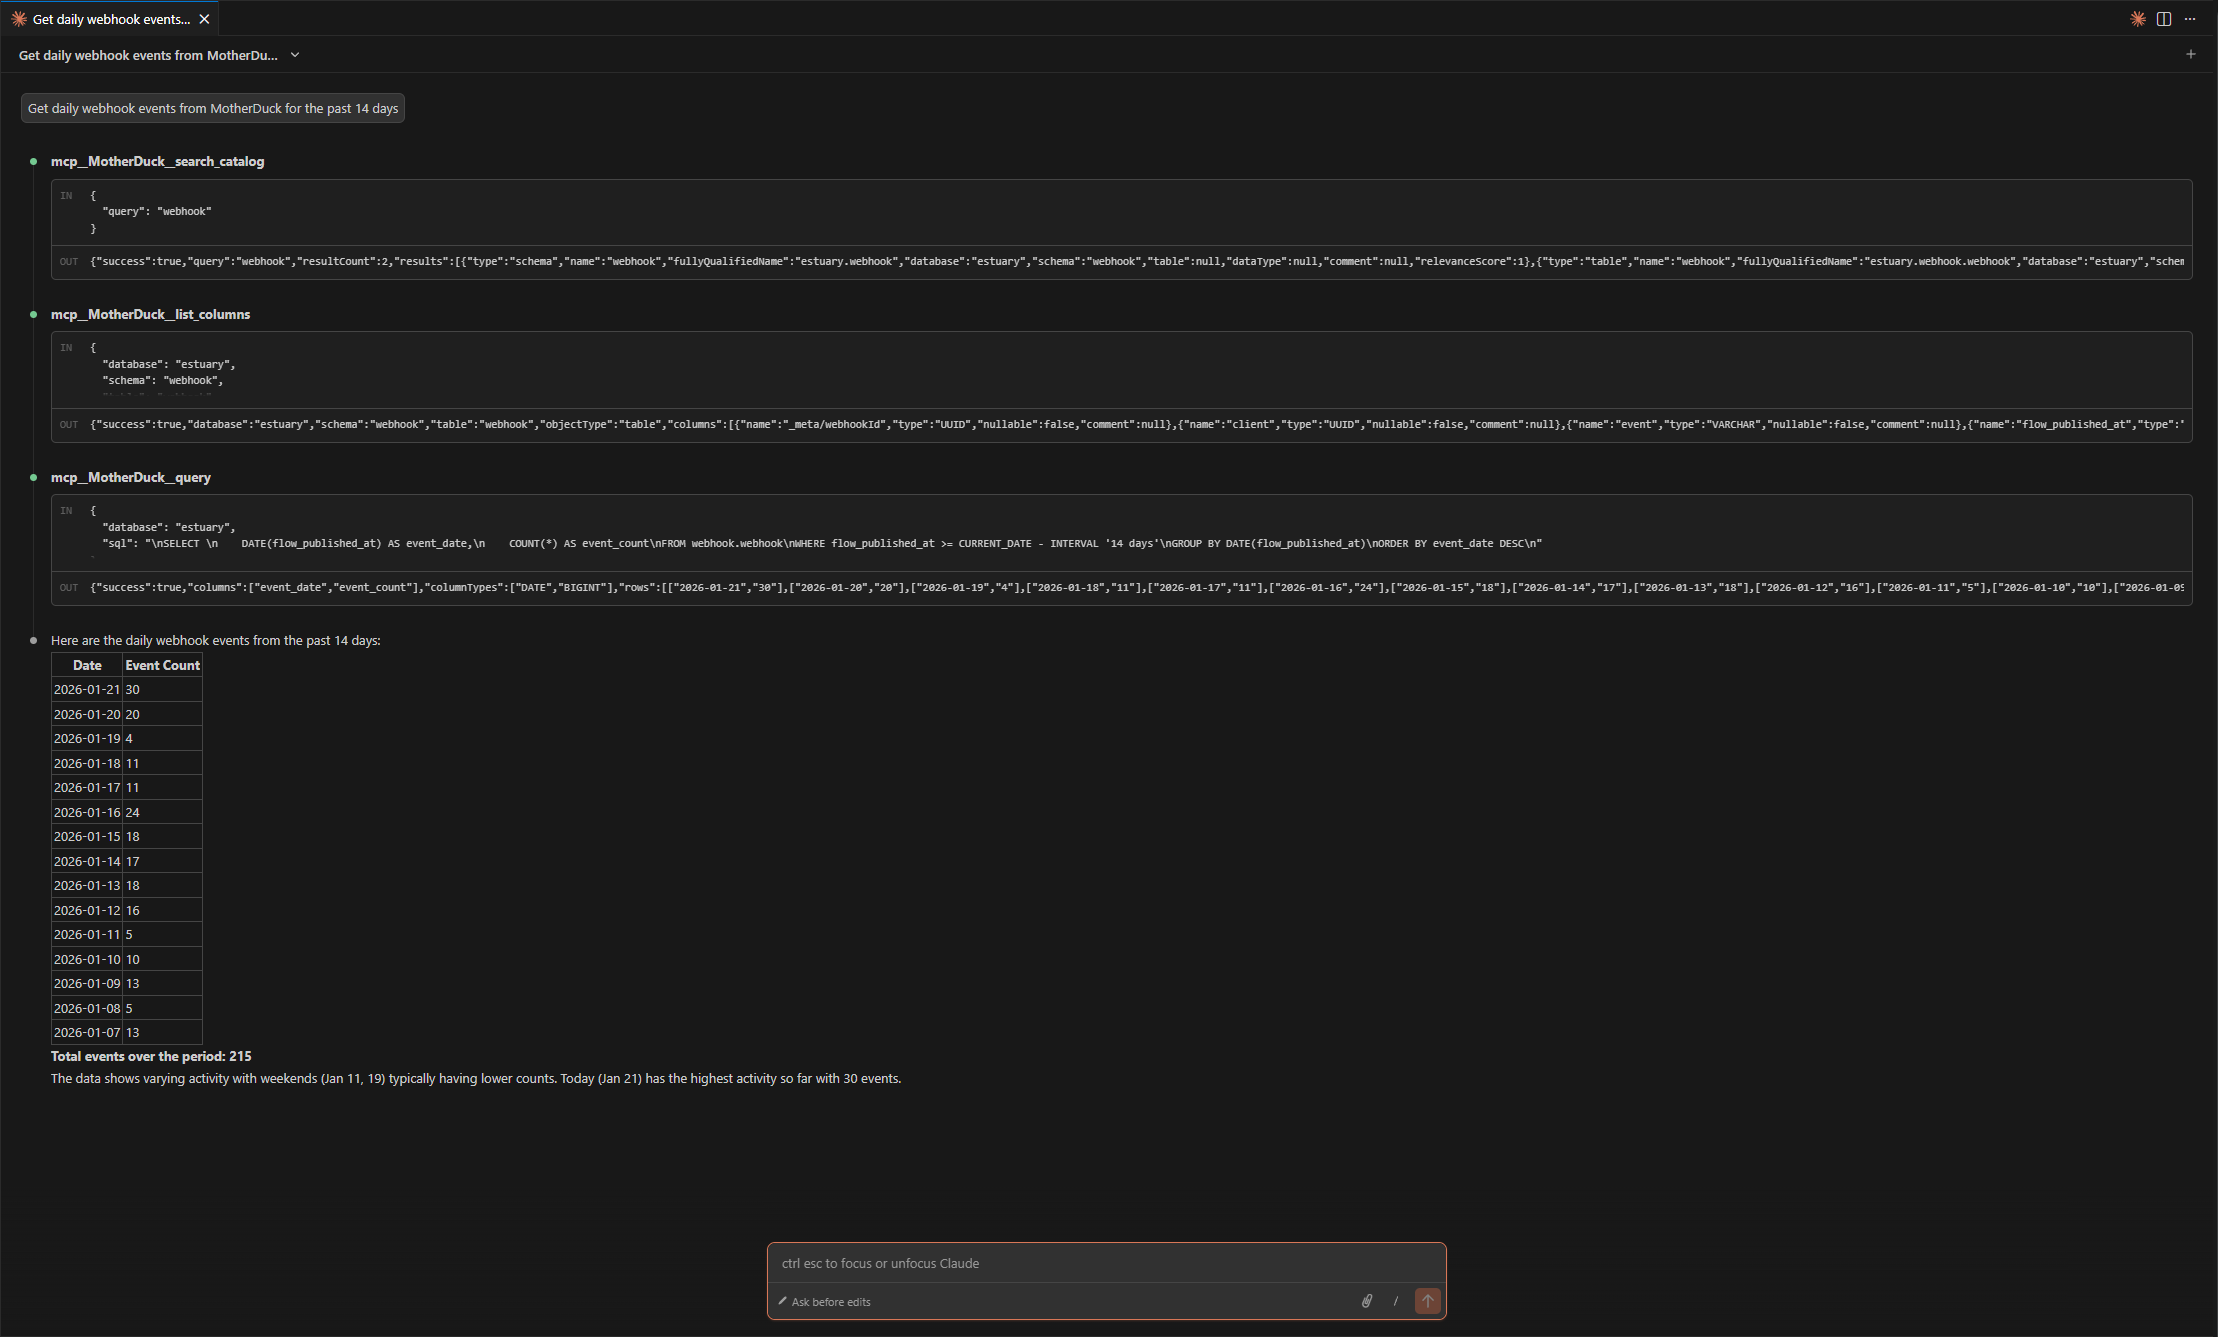
It found the correct data just using the catalog, object identifiers/types and column names - none of the objects in my MD even has any comments as you can see (yeah, I know... I'll do this later, I promise!) - and built a query:
SELECT
    DATE(flow_published_at) AS event_date,
    COUNT(*) AS event_count
FROM webhook.webhook
WHERE flow_published_at >= CURRENT_DATE - INTERVAL '14 days'
GROUP BY DATE(flow_published_at)
ORDER BY event_date DESC
Now, getting to this result using natural language is already cool, but I want a chart!
Drawing
As mentioned above, not every analytics quest has to end in building a dashboard - sometimes I (or a stakeholder) just need an answer to a particular question to take a decision. Still, a viz is usually better than a table. Ask anyone who doesn't work in finance 😜
So let's take Jacob's mviz on a ride! To get started Ashley was so kind to point me in the direction of this Gist:

And this linked to the repo:

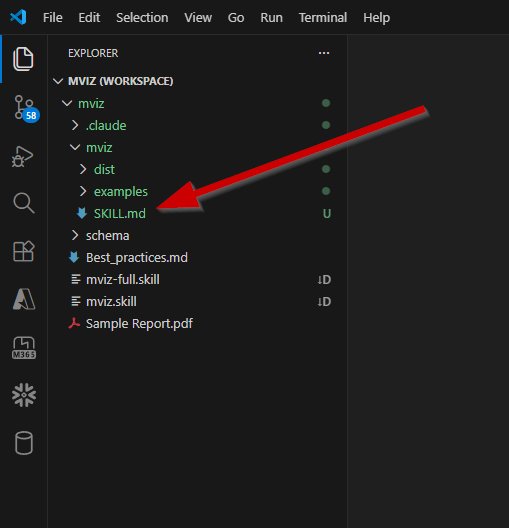
After a quick clone of the repo into VSCode I now have the skills in .skill files (and the Best_practices.md) from the repo locally. Those skills are made for Claude Desktop/Web, not Claude Code. But since skills are basically just a bunch of markdown instructions and some code snippets, they can be extracted and then used by Claude Code in the VSCode extension, too:
npx add-skill matsonj/mvizAfter fetching the data, Claude used mviz to created an .md with the chart specification:
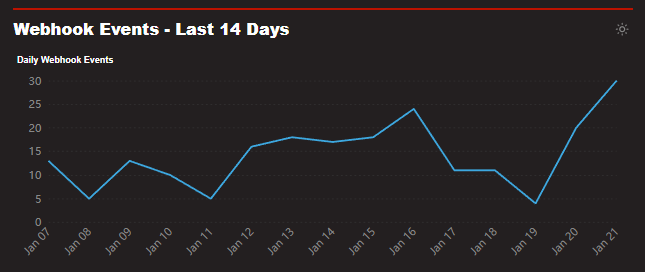
With this, I asked Claude to create the visualization and (after learning how mviz works) it called mviz webhook_events.md to create this .html file:
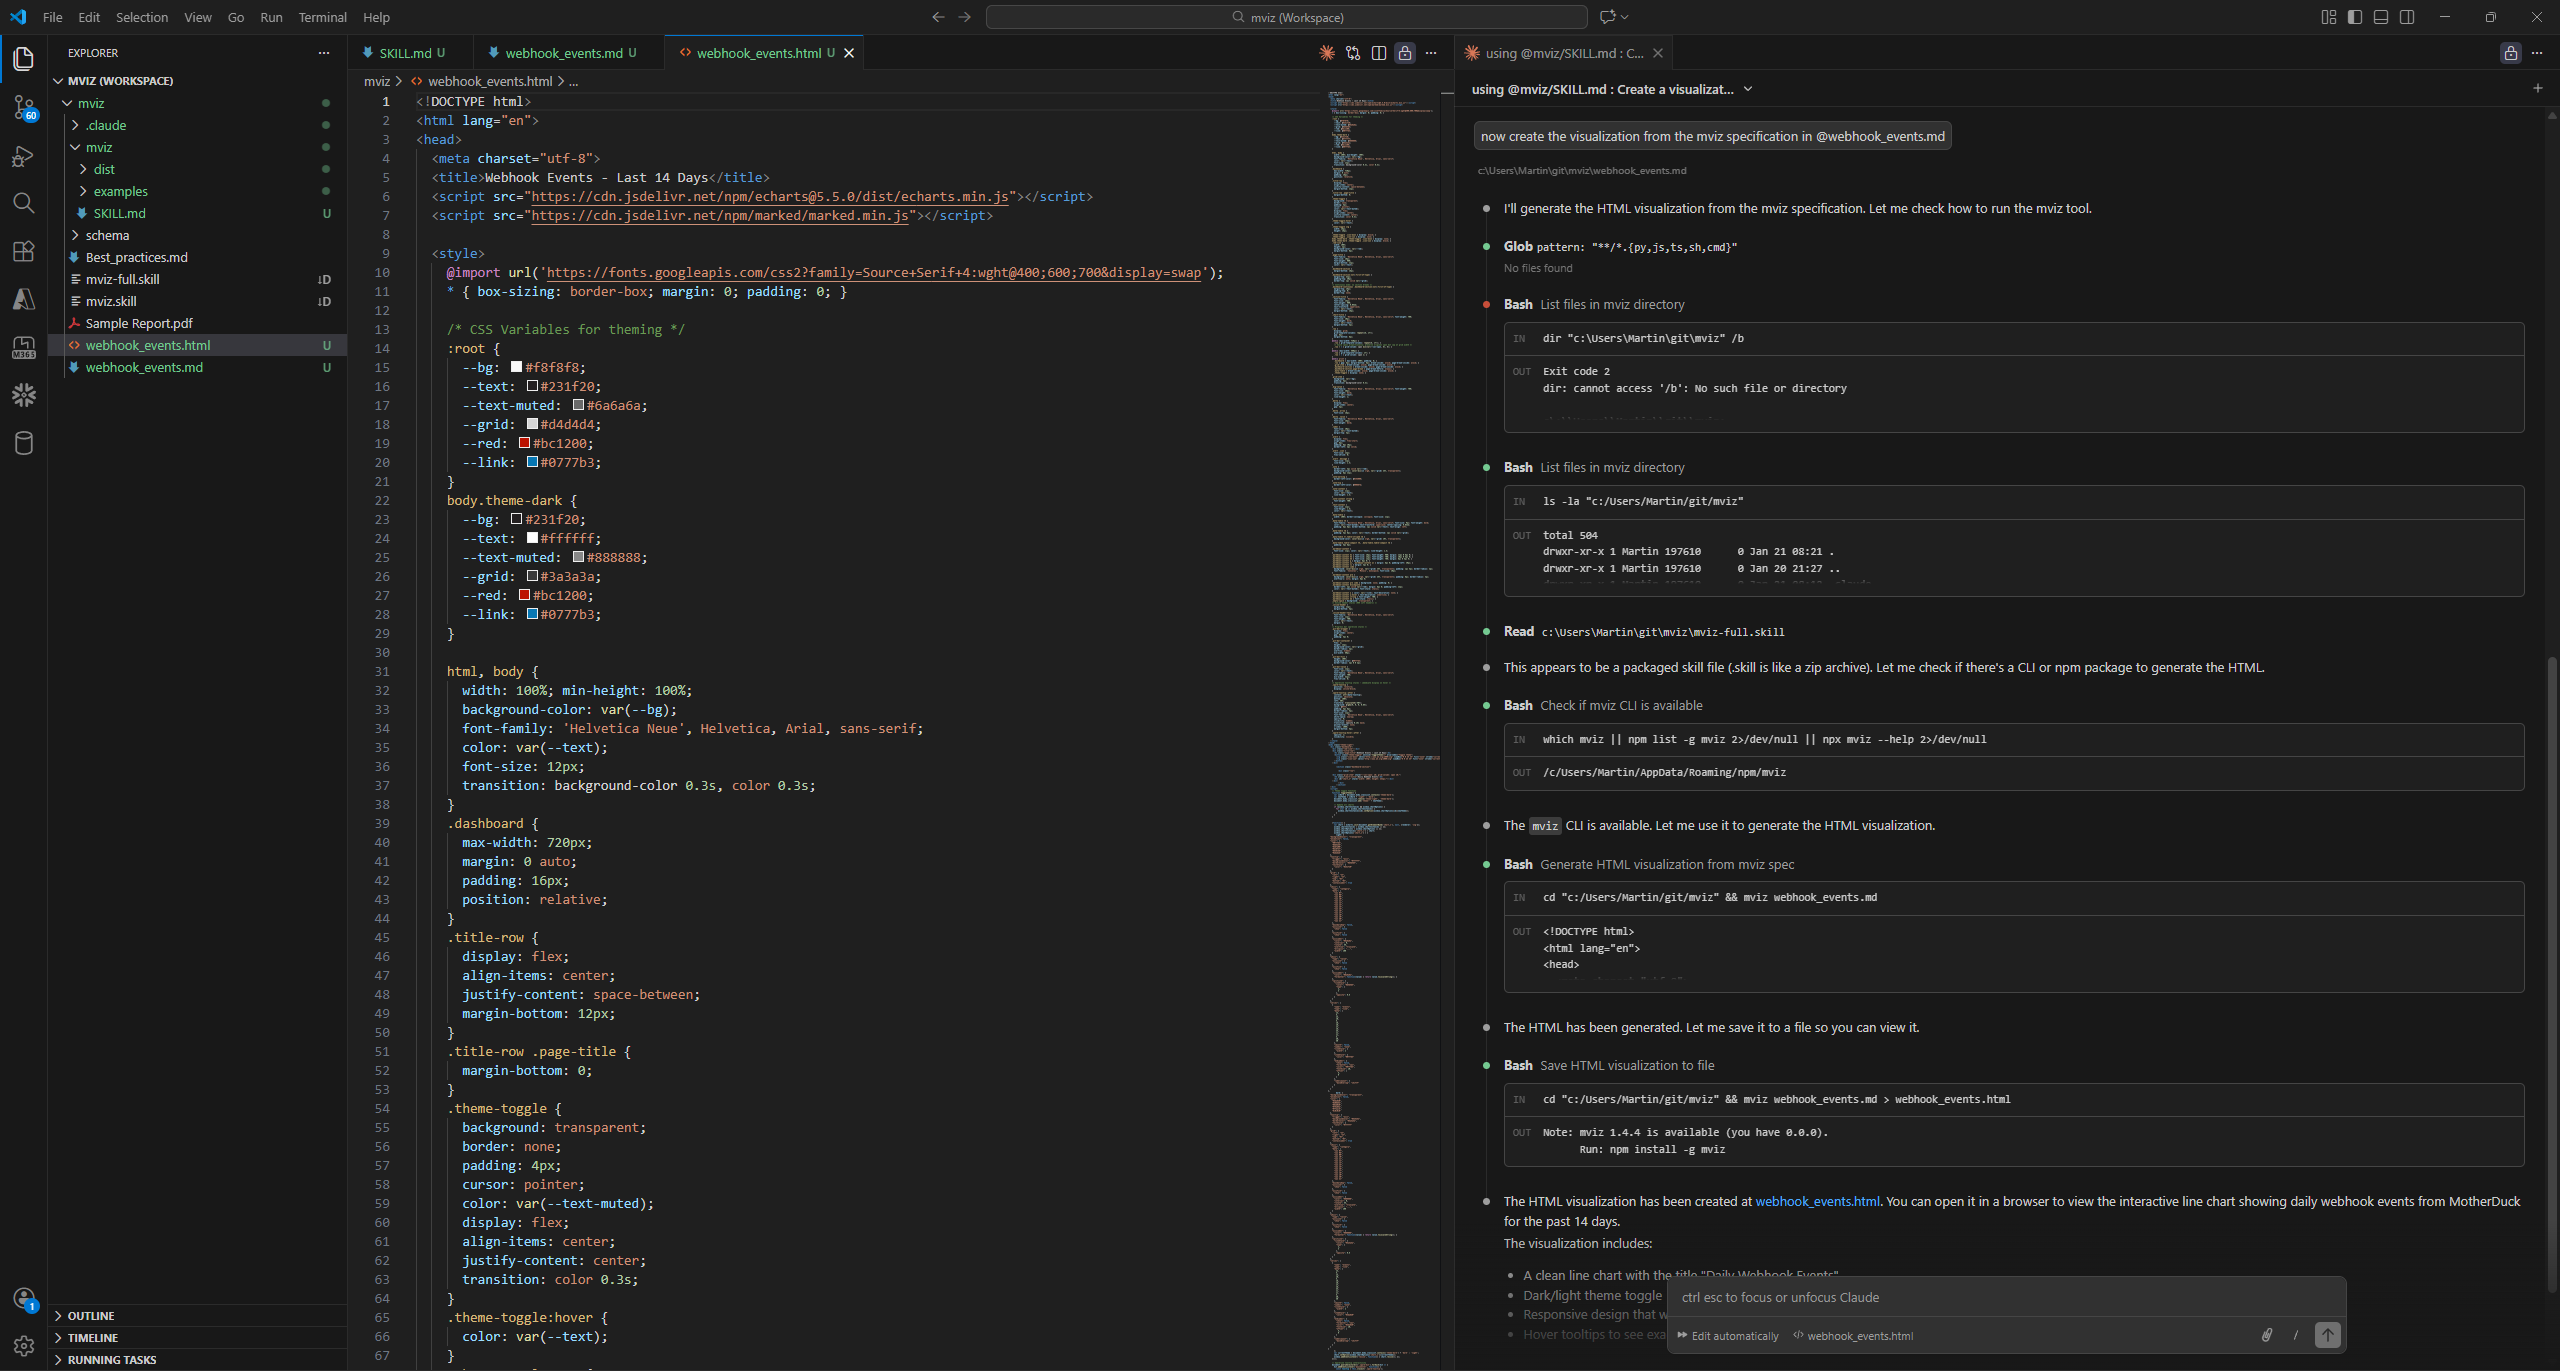
mviz uses Apache ECharts visualizations under the hood and can obviously do more than "just" create a single chart, but this is still a pretty good starting point for further iterations - just from 2 prompts:
Now, if we're in Claude Code anyway, why not let it create the .html file directly (using chart.js or whatever)? The point of mviz (as I understand it) is to use minimal tokens by utilizing a compact specification (the intermediary .md file). And I personally very much appreciate this approach of efficiency: In the end I just need a chart to take a decision, not a funky blinky something to distract from the actual message 😎