Snowflake Intelligence on Snowflake Cost: let the platform watch itself
Snowflake’s ACCOUNT_USAGE is powerful but often too complex. I built a cost analyst with Snowflake Intelligence: 19+ views merged into 6 tables, 25 billing rules, enabling questions like “why did costs spike?”


TL/DR: Built a natural-language cost analyst on top of ACCOUNT_USAGE using Cortex Analyst + Cortex Agent. Now I can ask "why did costs spike?" and get an actual answer.
Here's a recurring problem: Snowflake account admins have access to Snowflake's ACCOUNT_USAGE schema. It's powerful. Comprehensive. And nobody actually uses it. Too many views, too many confusing fields, no built-in business logic. So teams either pay for third-party monitoring tools or they leave costs rather opaque. But Snowflake has Cortex Intelligence, which means... why not build this natively?
Why ACCOUNT_USAGE is not enough
The ACCOUNT_USAGE schema has a fundamental problem: it's designed for accounting accuracy, not self-service analytics. That translates to friction at every turn.
First, the fragmentation. Credit data is scattered across 19+ views with wildly different grains: METERING_DAILY_HISTORY (one row per day per service type), METERING_HISTORY (hourly per entity), WAREHOUSE_METERING_HISTORY (hourly per warehouse), QUERY_HISTORY (one row per query), plus storage views, materialized view refresh views, serverless task views... the list goes on. A single question like "what was my total monthly bill?" requires joining and aggregating across multiple sources with different grains and latencies.
Second, the billing trap. There are two credit fields that look like they should tell the same story: CREDITS_USED and CREDITS_BILLED. They don't. Snowflake gives a 10% credit cushion for cloud services (metadata API calls, SHOW commands, Terraform usage). This cushion is free up to 10% of compute credits; beyond that, cloud services charges count. The adjustment appears in CREDITS_ADJUSTMENT_CLOUD_SERVICES (zero or negative) and only at the daily level. Miss this detail and billing reports will be off by quite a few credits.
Third, semi-additive metrics. Storage is a daily inventory snapshot, not a flow. If I store 100 TB for 30 days, that's not 3,000 TB-months. It's an average. Monthly billing requires AVG(daily_bytes), not SUM. Similar trap: hourly credit rows can be summed within a period, but they exclude the 10% adjustment and will double-count if mixed with daily billing totals.
Fourth, attribution is absent. Credits are assigned at the warehouse-hour level. To answer "which user burned the most compute?", I need to join QUERY_HISTORY to WAREHOUSE_METERING_HISTORY and pro-rate each user's share by their execution time. That's approximate, undocumented, and easy to get wrong.
The four-tier architecture
Tier 1: Raw ACCOUNT_USAGE. Direct reads, no ETL. Fresh within 3 hours, no maintenance burden.
Tier 2: Semantic view. A Cortex Analyst semantic model called SNOWFLAKE_CREDITS that consolidates 19+ ACCOUNT_USAGE views into 6 logical tables:
| Table | Source | Grain | Purpose |
|---|---|---|---|
DAILY_BILLING |
METERING_DAILY_HISTORY | One row per day per service type | Authoritative monthly totals |
HOURLY_METERING |
METERING_HISTORY | One row per hour per entity | All service types: compute, cloud services, serverless |
WAREHOUSE_HOURS |
WAREHOUSE_METERING_HISTORY | One row per hour per warehouse | Idle vs query attribution |
QUERIES |
QUERY_HISTORY | One row per query | User/role attribution, efficiency metrics |
ACCOUNT_STORAGE |
STORAGE_USAGE | One row per day | Account-level storage snapshots |
DATABASE_STORAGE |
DATABASE_STORAGE_USAGE_HISTORY | One row per day per database | Per-database storage breakdown |
Each table encodes business logic as expressions: idle credit ratios, pre-formatted month columns, cache hit classifications, spill severity. Cortex Analyst reads these as facts and dimensions, generating correct SQL automatically.
Tier 3: Knowledge base. A single table, META.CORTEX.T_KNOWLEDGE_BASE_SNOWFLAKE_CONSUMPTION, with 25 rules across five categories:
- Classification: What service types are, cache hit definitions, warehouse size costs, storage is in TB not credits
- Attribution: How to pro-rate user costs, role vs user splits, cloud services thresholds
- Driver: What causes cost changes (decomposition by service type, warehouse efficiency levers, storage growth drivers)
- Data Quality: Latency notes (QUERY_HISTORY is 45 min behind; METERING_HISTORY is 3 hours behind), the VARCHAR credits bug in serverless views, what happens to deleted databases
- Semi-Additive: Aggregation pitfalls (hourly summation, storage snapshot behavior)
When a user asks "why did costs increase?", the agent queries this table first, retrieves the relevant rule, and uses its investigation_query hint to generate analytical SQL. No hardcoded prompts, no guessing.
Tier 4: Cortex Agent. A natural-language interface, SNOWFLAKE_CREDITS_ANALYST, that orchestrates the semantic view and knowledge table. It speaks any natural language, surfaces latency caveats, redacts PII in SQL, and uses Perplexity Search for external context (current pricing, industry benchmarks), cf.:

Building it: six steps
Step 1: Grant the required permission. Cortex Analyst needs to read Snowflake's own system tables.
grant imported privileges on database snowflake
  to role cortex_analyst_role;
Step 2: Deploy the knowledge table. Adjust and paste and run the SQL script:
-- =============================================================================
-- T_KNOWLEDGE_BASE_SNOWFLAKE_CONSUMPTION — Credit Consumption Knowledge Base
-- Encodes business rules for Cortex Analyst cost analysis
-- =============================================================================

CREATE TABLE IF NOT EXISTS META.CORTEX.T_KNOWLEDGE_BASE_SNOWFLAKE_CONSUMPTION (
    category            VARCHAR(50)   NOT NULL,  -- classification, attribution, driver, data_quality, semi_additive
    rule_name           VARCHAR(100)  NOT NULL,  -- machine-readable identifier
    entity              VARCHAR(50)   NOT NULL,  -- DailyBilling, HourlyMetering, WarehouseHours, Queries, AccountStorage, DatabaseStorage
    description         VARCHAR(2000) NOT NULL,  -- human-readable explanation surfaced to users
    condition           VARCHAR(1000),           -- SQL predicate or pattern that implements this rule
    investigation_query VARCHAR(2000)            -- hint for Cortex Analyst: how to decompose a "why"
);

INSERT OVERWRITE INTO META.CORTEX.T_KNOWLEDGE_BASE_SNOWFLAKE_CONSUMPTION
VALUES

-- ============================================================================
-- CLASSIFICATION RULES — explain how entities and metrics are categorized
-- ============================================================================

('classification', 'billing_vs_usage', 'DailyBilling',
 'CREDITS_BILLED is the authoritative billing figure in METERING_DAILY_HISTORY. It equals CREDITS_USED + CREDITS_ADJUSTMENT_CLOUD_SERVICES. The adjustment returns up to 10% of daily compute credits when cloud services credits fall below 10% of compute. Never use CREDITS_USED as a billing figure — it overstates costs by ignoring the adjustment.',
 'CREDITS_BILLED = CREDITS_USED + CREDITS_ADJUSTMENT_CLOUD_SERVICES',
 'SELECT USAGE_DATE, SERVICE_TYPE, CREDITS_USED, CREDITS_ADJUSTMENT_CLOUD_SERVICES, CREDITS_BILLED FROM DAILY_BILLING WHERE CREDITS_ADJUSTMENT_CLOUD_SERVICES < 0 ORDER BY USAGE_DATE DESC'),

('classification', 'service_type_taxonomy', 'DailyBilling',
 'SERVICE_TYPE identifies the Snowflake service consuming credits. Common values: VIRTUAL_WAREHOUSE (query compute), AUTO_CLUSTERING (table maintenance), SERVERLESS_TASK (task execution), SEARCH_OPTIMIZATION (search index), MATERIALIZED_VIEW (MV refresh), REPLICATION (cross-region DB replication), SNOWPIPE (data ingestion), CLOUD_SERVICES (API overhead). VIRTUAL_WAREHOUSE typically dominates (70-90% of total).',
 'SERVICE_TYPE IN (''VIRTUAL_WAREHOUSE'', ''AUTO_CLUSTERING'', ''SERVERLESS_TASK'', ''SEARCH_OPTIMIZATION'', ''MATERIALIZED_VIEW'', ''REPLICATION'', ''SNOWPIPE'', ''CLOUD_SERVICES'')',
 'SELECT SERVICE_TYPE, SUM(CREDITS_BILLED) AS total_billed FROM DAILY_BILLING GROUP BY SERVICE_TYPE ORDER BY total_billed DESC'),

('classification', 'warehouse_size_cost', 'Queries',
 'Warehouse size directly determines credit consumption rate. X-Small=1/hour, Small=2/hr, Medium=4/hr, Large=8/hr, X-Large=16/hr, 2X-Large=32/hr, 3X-Large=64/hr, 4X-Large=128/hr, 5X-Large=256/hr, 6X-Large=512/hr. Multi-cluster warehouses scale linearly. Cost = size_multiplier × hours_running × cluster_count.',
 'WAREHOUSE_SIZE IN (''X-Small'',''Small'',''Medium'',''Large'',''X-Large'',''2X-Large'',''3X-Large'',''4X-Large'',''5X-Large'',''6X-Large'')',
 'SELECT WAREHOUSE_SIZE, COUNT(*) AS query_count, AVG(EXECUTION_TIME)/1000 AS avg_exec_secs, SUM(EXECUTION_TIME)/3600000 AS total_exec_hours FROM QUERIES WHERE EXECUTION_STATUS = ''success'' GROUP BY WAREHOUSE_SIZE ORDER BY WAREHOUSE_SIZE'),

('classification', 'cache_hit_classification', 'Queries',
 'PERCENTAGE_SCANNED_FROM_CACHE measures the fraction of bytes served from the local warehouse cache (0–1 scale). A value of 1.0 = 100% cache hit (result cache hit; query ran before within 24h). High cache rates reduce latency and cloud services overhead. Cache cost = 0; storage scan cost is proportional to BYTES_SCANNED.',
 'PERCENTAGE_SCANNED_FROM_CACHE = 1.0 (result cache) vs > 0.5 (warm cache) vs = 0 (cold scan)',
 'SELECT CASE WHEN PERCENTAGE_SCANNED_FROM_CACHE = 1 THEN ''result_cache'' WHEN PERCENTAGE_SCANNED_FROM_CACHE > 0.5 THEN ''warm_cache'' ELSE ''cold_scan'' END AS cache_type, COUNT(*) AS queries, AVG(EXECUTION_TIME)/1000 AS avg_secs FROM QUERIES WHERE EXECUTION_STATUS = ''success'' GROUP BY 1 ORDER BY 3 DESC'),

('classification', 'spill_severity', 'Queries',
 'Memory spill indicates insufficient warehouse memory for the operation. BYTES_SPILLED_TO_LOCAL_STORAGE (SSD spill) is moderate severity. BYTES_SPILLED_TO_REMOTE_STORAGE (object storage spill) is severe and can increase query cost 10-100x. Any remote spill is a strong signal to use a larger warehouse or optimize query memory usage.',
 'BYTES_SPILLED_TO_REMOTE_STORAGE > 0 (severe) vs BYTES_SPILLED_TO_LOCAL_STORAGE > 0 (moderate) vs both = 0 (clean)',
 'SELECT WAREHOUSE_NAME, WAREHOUSE_SIZE, COUNT(*) AS queries_with_remote_spill, ROUND(AVG(BYTES_SPILLED_TO_REMOTE_STORAGE)/1024/1024, 2) AS avg_remote_spill_mb FROM QUERIES WHERE BYTES_SPILLED_TO_REMOTE_STORAGE > 0 GROUP BY 1, 2 ORDER BY 3 DESC'),

('classification', 'query_history_latency', 'Queries',
 'QUERY_HISTORY in ACCOUNT_USAGE has a 45-minute data latency. It is not a real-time view. For live monitoring use INFORMATION_SCHEMA or live views. Use QUERY_HISTORY for historical analysis (trends, patterns, user behavior) and post-execution analysis, not for live dashboards.',
 'Data latency ~45 minutes from query end to visibility in ACCOUNT_USAGE.QUERY_HISTORY',
 'SELECT MAX(END_TIME), DATEDIFF(''minute'', MAX(END_TIME), CURRENT_TIMESTAMP()) AS lag_minutes FROM QUERIES'),

('classification', 'storage_bytes_not_credits', 'AccountStorage',
 'Storage views (STORAGE_USAGE, DATABASE_STORAGE_USAGE_HISTORY) measure bytes, not credits. Storage is billed monthly at a rate per TB-month (on-demand rate ~23–40 CHF/TB depending on contract and edition). To estimate storage cost: (STORAGE_BYTES / POWER(1024,4)) * monthly_per_TB_rate. Storage costs appear separately from credit costs on the invoice.',
 'Storage cost = TB * monthly_per_TB_rate; not measured in credits',
 'SELECT USAGE_DATE, ROUND(STORAGE_BYTES / POWER(1024,4), 4) AS storage_tb, ROUND(STAGE_BYTES / POWER(1024,4), 4) AS stage_tb, ROUND(FAILSAFE_BYTES / POWER(1024,4), 4) AS failsafe_tb FROM ACCOUNT_STORAGE ORDER BY USAGE_DATE DESC LIMIT 30'),

-- ============================================================================
-- DATA QUALITY RULES — caveats, latency, pitfalls, and data quirks
-- ============================================================================

('data_quality', 'query_credits_no_adjustment', 'Queries',
 'CREDITS_USED_CLOUD_SERVICES on QUERY_HISTORY does NOT reflect the 10% cloud services billing adjustment. It shows raw cloud services spend at the query level. The 10% adjustment is only computed at the daily account level in METERING_DAILY_HISTORY. Never sum QUERY_HISTORY.CREDITS_USED_CLOUD_SERVICES and expect it to match METERING_DAILY_HISTORY.CREDITS_BILLED.',
 'QUERY_HISTORY.CREDITS_USED_CLOUD_SERVICES ≠ DAILY_BILLING.CREDITS_BILLED for SERVICE_TYPE = VIRTUAL_WAREHOUSE',
 'SELECT DATE(START_TIME) AS dt, SUM(CREDITS_USED_CLOUD_SERVICES) AS query_cloud_svc FROM QUERIES GROUP BY dt ORDER BY dt DESC LIMIT 7'),

('data_quality', 'serverless_varchar_credits', 'HourlyMetering',
 'SERVERLESS_TASK_HISTORY and MATERIALIZED_VIEW_REFRESH_HISTORY have CREDITS_USED typed as VARCHAR (not NUMBER). Queries that SUM or perform math on these columns directly will fail. Always use TRY_CAST(CREDITS_USED AS FLOAT) when directly querying those views. In HOURLY_METERING (METERING_HISTORY), credits are correctly typed as NUMBER.',
 'SERVERLESS_TASK_HISTORY.CREDITS_USED data_type = VARCHAR; requires casting',
 'SELECT NAME, SUM(CREDITS_USED::NUMBER) AS credits FROM (SELECT NAME, CREDITS_USED FROM HOURLY_METERING WHERE SERVICE_TYPE = ''SERVERLESS_TASK'') GROUP BY NAME ORDER BY credits DESC'),

('data_quality', 'account_usage_latency', 'DailyBilling',
 'All ACCOUNT_USAGE views have data latency: QUERY_HISTORY 45 min, METERING_HISTORY/WAREHOUSE_METERING_HISTORY 3h (6h for cloud services), STORAGE_USAGE 2h. The current date''s data is typically partial or absent. Always filter USAGE_DATE < CURRENT_DATE() for complete-day analysis. Explain to users when "today''s" numbers are preliminary.',
 'USAGE_DATE < CURRENT_DATE() for complete data; today data is partial',
 'SELECT MAX(USAGE_DATE) AS latest_daily_date FROM DAILY_BILLING; SELECT MAX(DATE(START_TIME)) AS latest_hourly_date FROM WAREHOUSE_HOURS'),

('data_quality', 'deleted_databases', 'DatabaseStorage',
 'DATABASE_STORAGE_USAGE_HISTORY includes rows for dropped databases. The DELETED column holds the drop timestamp (NULL for active). For current storage analysis, filter IS_DELETED = FALSE (i.e., DELETED IS NULL). Dropped databases continue to consume fail-safe storage for 7 days, so rows remain with AVERAGE_FAILSAFE_BYTES > 0 during the fail-safe period.',
 'DELETED IS NULL (active) vs DELETED IS NOT NULL (dropped, may have fail-safe)',
 'SELECT DATABASE_NAME, IS_DELETED, MAX(USAGE_DATE) AS last_seen, ROUND(SUM(AVERAGE_DATABASE_BYTES)/POWER(1024,4), 4) AS total_db_tb FROM DATABASE_STORAGE GROUP BY 1,2 ORDER BY total_db_tb DESC'),

('data_quality', 'metering_history_is_master', 'HourlyMetering',
 'METERING_HISTORY is the master unified view containing ALL service types. WAREHOUSE_METERING_HISTORY is a convenience pre-filter (SERVICE_TYPE = ''VIRTUAL_WAREHOUSE''). They are not independent sources; WAREHOUSE_METERING_HISTORY data is a subset. Never add credits from both tables together — this double-counts warehouse credits.',
 'WAREHOUSE_HOURS is a filtered subset of HOURLY_METERING; do not SUM both',
 'SELECT DATE(START_TIME) AS dt, SUM(CREDITS_USED) FROM HOURLY_METERING WHERE SERVICE_TYPE = ''VIRTUAL_WAREHOUSE'' AND DATE(START_TIME) = ''2026-01-15'' GROUP BY dt'),

('data_quality', 'query_history_rows', 'Queries',
 'QUERY_HISTORY covers the last 365 days. Very long-running queries may have END_TIME far after START_TIME. Failed queries (EXECUTION_STATUS != ''success'') appear in the table but have zero execution_time (didn''t run). For efficiency analysis, filter EXECUTION_STATUS = ''success''.',
 'EXECUTION_STATUS = ''success'' for efficiency analysis; include all statuses for error analysis',
 'SELECT EXECUTION_STATUS, COUNT(*) AS cnt, AVG(TOTAL_ELAPSED_TIME)/1000 AS avg_secs FROM QUERIES GROUP BY EXECUTION_STATUS ORDER BY cnt DESC'),

-- ============================================================================
-- ATTRIBUTION RULES — how to map costs to users, teams, workloads
-- ============================================================================

('attribution', 'warehouse_credit_attribution', 'WarehouseHours',
 'Credits in WAREHOUSE_METERING_HISTORY are attributed to the warehouse, not to users or queries. To find per-user credit costs, join QUERY_HISTORY to WAREHOUSE_METERING_HISTORY by WAREHOUSE_NAME and hour, then pro-rate by each user''s execution_time share: user_cost_approx = (user_execution_time / total_execution_time_in_hour) × warehouse_credits_in_hour. This is an approximation — Snowflake does not expose exact per-query credit cost.',
 'Credits are warehouse-level; pro-rate: user_cost ≈ (user_exec_time / total_exec_time) × warehouse_credits',
 'SELECT USER_NAME, WAREHOUSE_NAME, SUM(EXECUTION_TIME)/1000 AS exec_secs, COUNT(*) AS queries FROM QUERIES WHERE DATE(START_TIME) = CURRENT_DATE() - 1 GROUP BY 1,2 ORDER BY exec_secs DESC'),

('attribution', 'role_vs_user_attribution', 'Queries',
 'ROLE_NAME is the active role at query execution time, not the user''s default role. The same user can execute under multiple roles (e.g., SYSADMIN for DDL, ANALYST for SELECT queries). Use ROLE_NAME for team/function cost allocation (e.g., "how much did DBA work cost?"). Use USER_NAME for individual accountability.',
 'USER_NAME for individual attribution; ROLE_NAME for team/function attribution',
 'SELECT ROLE_NAME, SUM(EXECUTION_TIME)/1000 AS total_exec_secs, COUNT(DISTINCT USER_NAME) AS users, COUNT(*) AS queries FROM QUERIES GROUP BY ROLE_NAME ORDER BY total_exec_secs DESC'),

('attribution', 'query_tag_attribution', 'Queries',
 'QUERY_TAG is an optional user/application-set tag on queries (set via ALTER SESSION SET QUERY_TAG = ''project_x'' or in connection strings). When populated, it enables precise workload attribution beyond warehouse/role. Many queries will have NULL query_tag. Filter QUERY_TAG IS NOT NULL to analyze only tagged workloads. Teams can use this for project-level cost tracking.',
 'QUERY_TAG IS NOT NULL for tagged attribution; NULL for untagged',
 'SELECT QUERY_TAG, COUNT(*) AS queries, SUM(EXECUTION_TIME)/1000 AS exec_secs FROM QUERIES WHERE QUERY_TAG IS NOT NULL GROUP BY QUERY_TAG ORDER BY exec_secs DESC'),

('attribution', 'cloud_services_10pct_threshold', 'DailyBilling',
 'The cloud services billing adjustment (CREDITS_ADJUSTMENT_CLOUD_SERVICES) is only applied when cloud services credits exceed 10% of daily compute credits. If cloud_services <= 10% of compute, they are free (adjustment = 0). If cloud_services > 10%, you only pay for the excess. Days with heavy API usage (Terraform, dbt, INFORMATION_SCHEMA, SHOW commands) can exceed the 10% threshold and trigger charges.',
 'Adjustment = 0 when CREDITS_USED_CLOUD_SERVICES <= 0.1 * CREDITS_USED_COMPUTE',
 'SELECT USAGE_DATE, CREDITS_USED_COMPUTE, CREDITS_USED_CLOUD_SERVICES, ROUND(CREDITS_USED_CLOUD_SERVICES/NULLIF(CREDITS_USED_COMPUTE,0)*100,1) AS cloud_pct_of_compute FROM DAILY_BILLING WHERE SERVICE_TYPE = ''VIRTUAL_WAREHOUSE'' AND CREDITS_USED_CLOUD_SERVICES > CREDITS_USED_COMPUTE * 0.1 ORDER BY USAGE_DATE DESC'),

('attribution', 'warehouse_idle_overhead', 'WarehouseHours',
 'CREDITS_ATTRIBUTED_COMPUTE_QUERIES represents the cost directly tied to query execution. The difference (CREDITS_USED_COMPUTE - CREDITS_ATTRIBUTED_COMPUTE_QUERIES) is overhead: warehouse startup time, auto-resume delay, and idle-while-running costs. A low query-attribution ratio suggests the warehouse spends significant time idle or resuming. Auto-suspend (suspend after 60s) can reduce this overhead.',
 'Idle overhead = CREDITS_USED_COMPUTE - CREDITS_ATTRIBUTED_COMPUTE_QUERIES',
 'SELECT WAREHOUSE_NAME, SUM(CREDITS_USED_COMPUTE) AS total_compute, SUM(CREDITS_ATTRIBUTED_COMPUTE_QUERIES) AS query_attr, ROUND(SUM(CREDITS_ATTRIBUTED_COMPUTE_QUERIES)/NULLIF(SUM(CREDITS_USED_COMPUTE),0)*100,1) AS attr_pct FROM WAREHOUSE_HOURS GROUP BY WAREHOUSE_NAME ORDER BY total_compute DESC'),

-- ============================================================================
-- DRIVER RULES — what causes cost changes and how to analyze them
-- ============================================================================

('driver', 'cost_decomposition', 'DailyBilling',
 'Total monthly credit cost decomposes as: Virtual Warehouse compute (70-90%), Cloud Services net (after 10% adjustment, 1-5%), Auto-Clustering, Serverless Tasks, Search Optimization, Replication, Snowpipe, and others (<1% typically). To explain a cost increase: identify which SERVICE_TYPE increased, then drill into WAREHOUSE_HOURS (for warehouse changes) or HOURLY_METERING (for non-warehouse services).',
 'Cost = warehouse_compute + cloud_services_net + non_warehouse_services',
 'SELECT USAGE_MONTH, SERVICE_TYPE, SUM(CREDITS_BILLED) AS billed FROM DAILY_BILLING GROUP BY 1,2 ORDER BY 1, 3 DESC'),

('driver', 'warehouse_efficiency_drivers', 'WarehouseHours',
 'Warehouse credit consumption is driven by: (1) query volume (more queries = more credits), (2) average query duration (longer execution = more credits), (3) warehouse size (larger size = more credits/hour), (4) auto-suspend delay (longer delay = more idle time), (5) multi-cluster scaling (more clusters = more parallel capacity but more cost). An increase in warehouse credits can come from any combination of these.',
 'Credits = warehouse_size_multiplier × active_hours × utilization_rate',
 'SELECT DATE(START_TIME) AS dt, WAREHOUSE_NAME, COUNT(*) AS queries, ROUND(AVG(EXECUTION_TIME)/1000, 1) AS avg_exec_secs, SUM(EXECUTION_TIME)/3600000 AS compute_hours FROM QUERIES WHERE DATE(START_TIME) >= DATEADD(''day'',-30, CURRENT_DATE()) GROUP BY 1,2 ORDER BY 1 DESC, 3 DESC'),

('driver', 'storage_growth_drivers', 'DatabaseStorage',
 'Database storage growth is driven by: (1) new data loaded, (2) Time Travel retention (each day of retention increases storage; configurable 0-90 days), (3) Fail-safe (always 7 days, non-configurable), (4) Clone depth (each clone shares base storage until diverges on writes). To reduce storage costs: shorten Time Travel on large transient tables, drop unused clones/snapshots, and move old data to archive tiers (cool/cold).',
 'Total storage ≈ active_data + time_travel_multiplier * daily_change_rate + failsafe',
 'SELECT DATABASE_NAME, USAGE_DATE, ROUND(AVERAGE_DATABASE_BYTES/POWER(1024,4),4) AS db_tb, ROUND(AVERAGE_FAILSAFE_BYTES/POWER(1024,4),4) AS failsafe_tb FROM DATABASE_STORAGE WHERE IS_DELETED = FALSE ORDER BY USAGE_DATE DESC, db_tb DESC LIMIT 50'),

('driver', 'cloud_services_spike_drivers', 'DailyBilling',
 'Cloud services spikes (days where it approaches 10% of compute) are driven by: (1) heavy INFORMATION_SCHEMA or SHOW command usage, (2) Terraform provider running many metadata API calls, (3) dbt or other tools calling DESCRIBE/SHOW on many tables, (4) Snowpark sessions with metadata overhead, (5) automated monitoring/backup tools querying metadata. Identify spiky days in DAILY_BILLING and correlate with QUERY_HISTORY to find the metadata-heavy user/role/application.',
 'CREDITS_USED_CLOUD_SERVICES / CREDITS_USED_COMPUTE > 0.10 on spike days',
 'SELECT USAGE_DATE, CREDITS_USED_CLOUD_SERVICES, CREDITS_USED_COMPUTE, ROUND(CREDITS_USED_CLOUD_SERVICES/NULLIF(CREDITS_USED_COMPUTE,0)*100,1) AS cs_pct FROM DAILY_BILLING WHERE SERVICE_TYPE = ''VIRTUAL_WAREHOUSE'' ORDER BY cs_pct DESC LIMIT 10'),

('driver', 'query_queuing_cause', 'Queries',
 'QUEUED_OVERLOAD_TIME > 0 means the warehouse was too busy to accept the query — it ran in a queue. This indicates the warehouse is under-sized or needs multi-cluster configuration. QUEUED_PROVISIONING_TIME > 0 means the warehouse was suspended and had to resume, adding latency. High queuing delays increase total_elapsed_time and can indicate capacity bottlenecks.',
 'QUEUED_OVERLOAD_TIME > 0 (concurrency) vs QUEUED_PROVISIONING_TIME > 0 (cold-start)',
 'SELECT WAREHOUSE_NAME, DATE(START_TIME) AS dt, COUNT(*) AS queries, SUM(CASE WHEN QUEUED_OVERLOAD_TIME > 0 THEN 1 ELSE 0 END) AS queued, ROUND(AVG(QUEUED_OVERLOAD_TIME)/1000, 2) AS avg_overload_secs FROM QUERIES GROUP BY 1,2 ORDER BY queued DESC'),

-- ============================================================================
-- SEMI-ADDITIVE RULES — metrics that violate standard aggregation rules
-- ============================================================================

('semi_additive', 'hourly_credits_not_summable', 'HourlyMetering',
 'Hourly credit rows represent discrete non-overlapping 1-hour windows. They CAN be summed across warehouses or services within a time period. They CANNOT be summed across the same hour from multiple tables (double-counting). When rolling up HOURLY_METERING to daily, ensure each hour is counted once. For official daily billing, always use DAILY_BILLING (the authoritative roll-up) — hourly sums do not include the 10% adjustment.',
 'SUM(HOURLY_METERING.CREDITS_USED) ≈ DAILY_BILLING.CREDITS_USED (no adjustment); ≠ DAILY_BILLING.CREDITS_BILLED',
 'SELECT DATE(START_TIME) AS dt, SUM(CREDITS_USED) AS hourly_sum FROM HOURLY_METERING WHERE SERVICE_TYPE = ''VIRTUAL_WAREHOUSE'' GROUP BY dt ORDER BY dt DESC LIMIT 7'),

('semi_additive', 'storage_daily_snapshot', 'AccountStorage',
 'STORAGE_USAGE and DATABASE_STORAGE_USAGE_HISTORY are daily snapshots, not incremental events or flows. Summing STORAGE_BYTES across multiple days does NOT give total storage consumed — it gives a meaningless inflated number (e.g., 100 TB stored for 30 days is NOT 3000 TB months). For monthly billing estimation, use AVG(STORAGE_BYTES) over the month: monthly_cost = AVG(storage_bytes) / POWER(1024,4) × monthly_rate_per_TB.',
 'Storage billing = AVG(daily_bytes over month) / POWER(1024,4) × rate; never SUM daily_bytes',
 'SELECT STORAGE_MONTH, ROUND(AVG(STORAGE_BYTES)/POWER(1024,4), 4) AS avg_storage_tb FROM ACCOUNT_STORAGE GROUP BY STORAGE_MONTH ORDER BY STORAGE_MONTH DESC');
It creates META.CORTEX.T_KNOWLEDGE_BASE_SNOWFLAKE_CONSUMPTION and inserts all 25 rules.
Step 3: Upload the semantic view. In Snowsight, go to Cortex Analyst → New Model, and paste the below YAML definition. It defines the 6 tables, dimensions, facts, metrics, and SQL generation rules:
name: SNOWFLAKE_CREDITS
module_custom_instructions:
question_categorization: |
This semantic model covers Snowflake credit consumption and storage usage for the entire account.
It reads directly from SNOWFLAKE.ACCOUNT_USAGE and enables cost monitoring, warehouse analysis,
query efficiency assessment, and storage trend analysis.
SUPPORTED TOPICS:
- Total monthly/weekly/daily credit billing by service type (VIRTUAL_WAREHOUSE, AUTO_CLUSTERING, SERVERLESS_TASK, etc.)
- Warehouse cost ranking and efficiency analysis (idle credits vs query-attributed credits)
- Per-user and per-role cost attribution via query execution time pro-rating
- Query efficiency metrics: cache hit rates, partition pruning, memory spill, queuing delays
- Storage consumption by database and tier (active data, fail-safe, archive)
- Cost drivers and "why" questions answered via KNOWLEDGE_BASE rules + analytical decomposition
- Trends and period-over-period comparisons (month-over-month, week-over-week)
LANGUAGE:
- Users may ask in German or English. German column synonyms are provided (Warehouse, Monat, Nutzer, etc.).
- Key German terms: Credits = Credits, Warehouse = Warehouse, Nutzer = User, Rolle = Role,
Storage = Storage, Datum = Date, Monat = Month
CLARIFICATION RULES:
- If user says "cost" without context, ask whether they mean credits (semantic layer measure) or CHF/USD (requires external rate lookup).
- If user asks for "today", explain that ACCOUNT_USAGE has 3h latency and today's data is incomplete.
- If user asks for "top X" warehouses or users, clarify whether they want top by total credits, average, or a date range.
- If user asks "why did credits increase", probe for root cause: warehouse size increase? query volume spike? cache efficiency drop? new services?
UNSUPPORTED TOPICS — politely decline:
- Individual query SQL or application code optimization (provide CACHE_HIT_RATE, SPILL_RATE; user must optimize)
- Snowflake account configuration beyond ACCOUNT_USAGE data (contact Snowflake Support)
- CHF/USD pricing conversion (use Perplexity Search for current Snowflake rates)
- Snowflake internal algorithms or billing system internals
sql_generation: |
SEMI-ADDITIVE MEASURES — CRITICAL:
- Hourly credits in HOURLY_METERING and WAREHOUSE_HOURS are discrete non-overlapping hour windows.
- They CAN be summed across warehouses within a time period.
- They CANNOT be summed across the same hour from multiple tables (double-counting).
- For official daily billing, always use DAILY_BILLING (METERING_DAILY_HISTORY), which is the roll-up source.
- Storage metrics (STORAGE_BYTES, AVERAGE_DATABASE_BYTES) are daily snapshots — never SUM across days.
For monthly billing: AVG(storage_bytes over month) / POWER(1024,4) × monthly_rate_per_TB.
BILLING VS USAGE:
- CREDITS_BILLED = authoritative billing figure (CREDITS_USED + CREDITS_ADJUSTMENT_CLOUD_SERVICES).
- CREDITS_USED = raw total before 10% cloud services free-tier adjustment.
- QUERIES.CREDITS_USED_CLOUD_SERVICES ≠ DAILY_BILLING.CREDITS_BILLED (no billing adjustment at query grain).
- Always use DAILY_BILLING.CREDITS_BILLED for billing and cost reporting.
DATA LATENCY AND FILTERING:
- DAILY_BILLING, HOURLY_METERING, WAREHOUSE_HOURS: 3h latency. Filter USAGE_DATE < CURRENT_DATE() for complete data.
- QUERY_HISTORY: 45min latency. Highest granularity but slowest to appear.
- STORAGE_USAGE, DATABASE_STORAGE_USAGE_HISTORY: 2–3h latency.
- Explain to users when current-day data is partial.
WAREHOUSE AND SERVICE RELATIONSHIPS:
- WAREHOUSE_HOURS is a pre-filtered subset of HOURLY_METERING (SERVICE_TYPE = 'VIRTUAL_WAREHOUSE').
- Never SUM HOURLY_METERING + WAREHOUSE_HOURS — this double-counts warehouse credits.
- HOURLY_METERING is the master; WAREHOUSE_HOURS is a convenience view.
PER-USER AND PER-ROLE ATTRIBUTION:
- Credits are assigned to warehouses, not directly to queries.
- To estimate per-user cost: JOIN QUERIES → WAREHOUSE_HOURS, pro-rate by user's execution_time share.
- ROLE_NAME in QUERIES is the active role at query execution time (may differ from user's default role).
- Use ROLE_NAME for team/function cost allocation; USER_NAME for individual accountability.
- QUERY_TAG (optional) enables precise workload attribution when set by applications.
WAREHOUSE SIZE AND CREDIT RATE:
- Warehouse size directly determines credit consumption: X-Small=1/hr, Small=2/hr, Medium=4/hr, Large=8/hr,
X-Large=16/hr, 2X-Large=32/hr, 3X-Large=64/hr, 4X-Large=128/hr.
- Multi-cluster warehouses: credits scale linearly with cluster count.
CLOUD SERVICES 10% ADJUSTMENT:
- Cloud services credits are free if ≤ 10% of daily compute credits.
- If > 10%, you pay for the excess above 10%.
- CREDITS_ADJUSTMENT_CLOUD_SERVICES shows the daily free-tier credit returned (always ≤ 0).
- Spikes are driven by metadata API calls (INFORMATION_SCHEMA, SHOW commands, Terraform, dbt).
QUERY EFFICIENCY FILTERS:
- Filter EXECUTION_STATUS = 'success' by default for efficiency metrics (CACHE_HIT_RATE, PARTITION_PRUNING, SPILL_RATE).
- PERCENTAGE_SCANNED_FROM_CACHE = 1.0: result cache hit (near-zero execution time).
- BYTES_SPILLED_TO_REMOTE_STORAGE > 0: severe memory pressure; suggest larger warehouse.
- QUEUED_OVERLOAD_TIME > 0: warehouse too busy (concurrency issue); consider multi-cluster or larger size.
- QUEUED_PROVISIONING_TIME > 0: warehouse was suspended; reduce auto-suspend delay for predictable workloads.
STORAGE TIER BREAKDOWN:
- STORAGE_BYTES: active data (billed ~23–40 CHF/TB/month depending on contract).
- FAILSAFE_BYTES: mandatory 7-day fail-safe retention (billed as storage).
- ARCHIVE_STORAGE_COOL_BYTES, ARCHIVE_STORAGE_COLD_BYTES: cheaper long-term tiers with retrieval fees.
- Dropped databases retain fail-safe bytes for 7 days (DELETED IS NOT NULL, AVERAGE_FAILSAFE_BYTES > 0).
JOINS AND GRAIN MISMATCHES:
- QUERIES (query execution grain) joins to WAREHOUSE_HOURS (hourly grain): many queries per warehouse-hour.
- DATABASE_STORAGE (daily per-database grain) joins to ACCOUNT_STORAGE (daily account grain): many databases per day.
- DO NOT join hourly to daily directly — causes incorrect aggregation. Group by grain first, then join.
FORMATTING:
- Credits: 2 decimal places.
- Storage: 4 decimal places in TB.
- Percentages: 1–2 decimal places.
- Ratios: 4 decimal places (cache_hit_rate, spill_rate, pruning_ratio).
- Dates: YYYY-MM-DD or YYYY-MM for grouping.
- Order results by the most relevant measure DESC, NULLS LAST.
"WHY" QUESTIONS:
- When user asks "why did X increase/decrease", first query the KNOWLEDGE_BASE table for relevant rules.
- Filter KNOWLEDGE_BASE by entity and category to find matching business logic.
- Use the investigation_query hint to construct the analytical follow-up query.
- Decompose the metric: e.g., cost change = (volume change) + (average cost per unit change) + (service type mix change).
tables:
- name: DAILY_BILLING
description: >-
Daily per-service-type billing summary. The authoritative source for credit billing figures.
CREDITS_BILLED is the amount actually charged (includes 10% cloud services free-tier adjustment).
One row per SERVICE_TYPE per day. Use this table for all cost reporting and monthly billing questions.
base_table:
database: SNOWFLAKE
schema: ACCOUNT_USAGE
table: METERING_DAILY_HISTORY
primary_key:
columns: [USAGE_DATE, SERVICE_TYPE]
dimensions:
- name: SERVICE_TYPE
synonyms: [Servicetyp, Service Type]
description: >-
Category of Snowflake service consuming credits. Examples: VIRTUAL_WAREHOUSE (query compute),
AUTO_CLUSTERING (background table maintenance), SERVERLESS_TASK (task execution without a warehouse),
SEARCH_OPTIMIZATION (search index maintenance), MATERIALIZED_VIEW (materialized view refresh),
REPLICATION (cross-region database replication), SNOWPIPE (continuous data ingestion),
CLOUD_SERVICES (API call overhead). VIRTUAL_WAREHOUSE typically dominates (70-90% of total).
expr: SERVICE_TYPE
data_type: string
sample_values: [VIRTUAL_WAREHOUSE, AUTO_CLUSTERING, SERVERLESS_TASK, SEARCH_OPTIMIZATION]
- name: USAGE_MONTH
synonyms: [Monat, Month]
description: Pre-formatted year-month (YYYY-MM) for monthly trend grouping and aggregation.
expr: TO_VARCHAR(DATE_TRUNC('month', USAGE_DATE), 'YYYY-MM')
data_type: string
sample_values: ['2026-01', '2026-02', '2026-03']
- name: USAGE_WEEK
synonyms: [Woche, Week]
description: ISO week start date as YYYY-MM-DD string for weekly trend analysis.
expr: TO_VARCHAR(DATE_TRUNC('week', USAGE_DATE), 'YYYY-MM-DD')
data_type: string
sample_values: ['2026-01-05', '2026-01-12', '2026-01-19']
time_dimensions:
- name: USAGE_DATE
synonyms: [Datum, Date]
description: >-
Calendar date of the billing record. Use USAGE_DATE < CURRENT_DATE() for complete data
(accounts for 3h latency in ACCOUNT_USAGE). Current day's data is incomplete.
expr: USAGE_DATE
data_type: date
sample_values: ['2026-01-15', '2026-02-10', '2026-03-05']
facts:
- name: CREDITS_BILLED
synonyms: [Fakturierte Credits, Billed Credits]
description: >-
AUTHORITATIVE BILLING FIGURE. The amount actually charged to the account.
Equals CREDITS_USED + CREDITS_ADJUSTMENT_CLOUD_SERVICES (the adjustment returns up to 10% of daily compute).
Always use this metric for billing and cost reporting (never use CREDITS_USED).
expr: CREDITS_BILLED
data_type: real
- name: CREDITS_USED_COMPUTE
synonyms: [Compute Credits, Compute Credits]
description: >-
Compute-only credits before any adjustment. Use to analyze compute vs cloud services cost split.
Determined by warehouse size, duration running, and multi-cluster scale.
expr: CREDITS_USED_COMPUTE
data_type: real
- name: CREDITS_USED_CLOUD_SERVICES
synonyms: [Cloud Services Credits, Cloud Services Credits]
description: >-
Cloud services cost component before the 10% free-tier adjustment. Informational only.
Driven by metadata API calls (SHOW, INFORMATION_SCHEMA, Terraform, dbt), not query execution.
expr: CREDITS_USED_CLOUD_SERVICES
data_type: real
- name: CREDITS_ADJUSTMENT_CLOUD_SERVICES
synonyms: [Cloud Services Anpassung, Cloud Services Adjustment]
description: >-
The 10% free-tier credit returned (always negative or zero). Shows how much cloud services
was waived on a given day. Non-zero only when cloud services > 10% of compute.
expr: CREDITS_ADJUSTMENT_CLOUD_SERVICES
data_type: real
- name: CREDITS_USED
synonyms: [Credits Genutzt, Credits Used (Raw)]
description: >-
Raw total credits before the cloud services adjustment. Do NOT use for billing — it overstates costs.
For official billing, always use CREDITS_BILLED.
expr: CREDITS_USED
data_type: real
metrics:
- name: TOTAL_CREDITS_BILLED
synonyms: [Gesamte fakturierte Credits, Total Billed Credits]
description: >-
Total billed credits across all service types. The primary cost metric for all cost reporting,
budget tracking, and monthly billing reconciliation.
expr: SUM(CREDITS_BILLED)
- name: TOTAL_CREDITS_COMPUTE
synonyms: [Gesamte Compute Credits, Total Compute Credits]
description: >-
Total compute-only credits. Use to understand the split between compute and cloud services.
expr: SUM(CREDITS_USED_COMPUTE)
- name: TOTAL_CLOUD_SERVICES_ADJUSTMENT
synonyms: [Gesamtanpassung Cloud Services, Total Cloud Services Adjustment]
description: >-
Total 10% free-tier cloud services credit returned. Shows cumulative savings from the adjustment.
expr: SUM(CREDITS_ADJUSTMENT_CLOUD_SERVICES)
- name: AVG_DAILY_CREDITS_BILLED
synonyms: [Durchschnittliche tägliche Credits, Average Daily Billed Credits]
description: >-
Average daily billing rate. Useful for burn-rate tracking, monthly forecasting, and budget pacing.
expr: AVG(CREDITS_BILLED)
- name: HOURLY_METERING
description: >-
Master unified hourly view covering all service types and entities in one table.
One row per service entity per hour. METERING_HISTORY consolidates warehouse queries,
auto-clustering, serverless tasks, search optimization, and all other services.
Use this table to drill into non-warehouse services or analyze service-type contribution.
Note: Do not mix with WAREHOUSE_HOURS (which is a pre-filtered subset of this table).
base_table:
database: SNOWFLAKE
schema: ACCOUNT_USAGE
table: METERING_HISTORY
primary_key:
columns: [START_TIME, ENTITY_ID, SERVICE_TYPE]
dimensions:
- name: SERVICE_TYPE
synonyms: [Servicetyp, Service Type]
description: Service category for hourly granularity. Same values as DAILY_BILLING.SERVICE_TYPE.
expr: SERVICE_TYPE
data_type: string
sample_values: [VIRTUAL_WAREHOUSE, AUTO_CLUSTERING, SERVERLESS_TASK]
- name: NAME
synonyms: [Name, Entity Name]
description: >-
Human-readable entity name. Examples: warehouse name, task name, database name, pipe name.
Identifies the specific resource consuming credits.
expr: NAME
data_type: string
sample_values: [compute_wh, ingest_task, prod_db]
- name: ENTITY_TYPE
synonyms: [Entity Type, Entity Type]
description: Technical entity type string. Useful for filtering within a service type category.
expr: ENTITY_TYPE
data_type: string
sample_values: [WAREHOUSE, TASK, DATABASE]
- name: DATABASE_NAME
synonyms: [Datenbank, Database]
description: >-
Database name. NULL for account-level services (REPLICATION, CLOUD_SERVICES).
Use to filter by database or analyze per-database service consumption.
expr: DATABASE_NAME
data_type: string
sample_values: [PROD, STAGING, RAW]
- name: SCHEMA_NAME
synonyms: [Schema, Schema]
description: >-
Schema name. NULL for warehouse or account-level services.
Use to analyze within-database service consumption.
expr: SCHEMA_NAME
data_type: string
sample_values: [PUBLIC, ANALYTICS, TEMP]
- name: HOUR_OF_DAY
synonyms: [Stunde des Tages, Hour of Day]
description: >-
Hour of the day (0–23). Use to identify peak-usage hours and time-of-day patterns.
expr: HOUR(START_TIME)
data_type: integer
sample_values: [0, 6, 12, 18, 23]
- name: DAY_OF_WEEK
synonyms: [Wochentag, Day of Week]
description: >-
Day of the week (0=Sunday, 1=Monday, ..., 6=Saturday). Use for weekday vs weekend analysis.
expr: DAYOFWEEK(START_TIME)
data_type: integer
sample_values: [0, 1, 2, 5]
time_dimensions:
- name: START_TIME
synonyms: [Startzeit, Start Time]
description: >-
Hour window start timestamp. Primary time filter for hourly analysis.
Each row represents a discrete 1-hour window ending at END_TIME.
expr: START_TIME
data_type: timestamp
sample_values: ['2026-01-15 10:00:00.000', '2026-01-15 11:00:00.000', '2026-01-15 12:00:00.000']
- name: END_TIME
synonyms: [Endzeit, End Time]
description: Hour window end timestamp. Always START_TIME + 1 hour.
expr: END_TIME
data_type: timestamp
sample_values: ['2026-01-15 11:00:00.000', '2026-01-15 12:00:00.000', '2026-01-15 13:00:00.000']
facts:
- name: ENTITY_ID
synonyms: [Entity ID, Entity ID]
description: >-
Internal numeric ID of the entity. Useful for tracking entities that have been renamed.
expr: ENTITY_ID
data_type: integer
- name: CREDITS_USED
synonyms: [Credits Genutzt, Credits Used]
description: >-
Total credits consumed by this entity in this hour (no billing adjustment — hourly grain).
For billing, roll up to daily using DAILY_BILLING which applies the 10% adjustment.
expr: CREDITS_USED
data_type: real
- name: CREDITS_USED_COMPUTE
synonyms: [Compute Credits, Compute Credits]
description: Compute-only portion of credits for this entity-hour.
expr: CREDITS_USED_COMPUTE
data_type: real
- name: CREDITS_USED_CLOUD_SERVICES
synonyms: [Cloud Services Credits, Cloud Services Credits]
description: Cloud services portion for this entity-hour.
expr: CREDITS_USED_CLOUD_SERVICES
data_type: real
- name: BYTES
synonyms: [Bytes, Bytes]
description: >-
Bytes processed by this service entity in this hour. Applicable to some service types.
Use to analyze data volume processed per service.
expr: BYTES
data_type: integer
- name: ROWS_PROCESSED
synonyms: [Rows, Rows Processed]
description: >-
Rows processed by this service entity in this hour. Applicable to some service types.
expr: '"ROWS"'
data_type: integer
metrics:
- name: TOTAL_CREDITS_USED
synonyms: [Gesamte Credits genutzt, Total Credits Used]
description: >-
Aggregated credits (note: no billing adjustment — use DAILY_BILLING for official billing figures).
expr: SUM(CREDITS_USED)
- name: TOTAL_CREDITS_COMPUTE
synonyms: [Gesamte Compute Credits, Total Compute Credits]
description: Compute-only credits aggregated.
expr: SUM(CREDITS_USED_COMPUTE)
- name: TOTAL_BYTES
synonyms: [Gesamte Bytes, Total Bytes]
description: Total bytes processed across entities or time periods.
expr: SUM(BYTES)
- name: WAREHOUSE_HOURS
description: >-
Warehouse-specific hourly credit consumption with breakdown of idle vs query-attributed costs.
Pre-filtered subset of HOURLY_METERING (SERVICE_TYPE = 'VIRTUAL_WAREHOUSE').
CREDITS_ATTRIBUTED_COMPUTE_QUERIES shows the cost directly tied to query execution;
the difference (CREDITS_USED_COMPUTE - CREDITS_ATTRIBUTED_COMPUTE_QUERIES) is overhead.
One row per warehouse per hour.
base_table:
database: SNOWFLAKE
schema: ACCOUNT_USAGE
table: WAREHOUSE_METERING_HISTORY
primary_key:
columns: [START_TIME, WAREHOUSE_ID]
dimensions:
- name: WAREHOUSE_NAME
synonyms: [Warehouse Name, Warehouse]
description: >-
Name of the virtual warehouse. Primary grouping dimension for warehouse-level cost analysis,
budgeting, and performance monitoring.
expr: WAREHOUSE_NAME
data_type: string
sample_values: [COMPUTE_WH, INGEST_WH, ANALYTICS_WH]
- name: WAREHOUSE_ID
synonyms: [Warehouse ID, Warehouse ID]
description: >-
Internal numeric warehouse ID. Useful for tracking warehouses that have been renamed
without losing historical continuity.
expr: WAREHOUSE_ID
data_type: integer
time_dimensions:
- name: START_TIME
synonyms: [Startzeit, Start Time]
description: Hour window start timestamp for this warehouse. One hour of data per row.
expr: START_TIME
data_type: timestamp
sample_values: ['2026-01-15 10:00:00.000', '2026-01-15 11:00:00.000', '2026-01-15 12:00:00.000']
- name: END_TIME
synonyms: [Endzeit, End Time]
description: Hour window end timestamp (START_TIME + 1 hour).
expr: END_TIME
data_type: timestamp
sample_values: ['2026-01-15 11:00:00.000', '2026-01-15 12:00:00.000', '2026-01-15 13:00:00.000']
facts:
- name: CREDITS_USED
synonyms: [Credits Genutzt, Credits Used]
description: Total credits consumed by this warehouse in this hour.
expr: CREDITS_USED
data_type: real
- name: CREDITS_USED_COMPUTE
synonyms: [Compute Credits, Compute Credits]
description: Total compute credits for this warehouse-hour.
expr: CREDITS_USED_COMPUTE
data_type: real
- name: CREDITS_USED_CLOUD_SERVICES
synonyms: [Cloud Services Credits, Cloud Services Credits]
description: Cloud services credits for this warehouse-hour.
expr: CREDITS_USED_CLOUD_SERVICES
data_type: real
- name: CREDITS_ATTRIBUTED_COMPUTE_QUERIES
synonyms: [Query Credits, Query-Attributed Compute Credits]
description: >-
Credits directly attributed to query execution. Subset of CREDITS_USED_COMPUTE.
The difference (CREDITS_USED_COMPUTE - CREDITS_ATTRIBUTED_COMPUTE_QUERIES) represents
warehouse overhead (idle time, startup, resume). High overhead suggests under-utilization.
expr: CREDITS_ATTRIBUTED_COMPUTE_QUERIES
data_type: real
metrics:
- name: TOTAL_WAREHOUSE_CREDITS
synonyms: [Warehouse Credits, Warehouse Credits]
description: >-
Total credits consumed by this warehouse across the time period.
The key metric for warehouse cost ranking, budgeting, and right-sizing.
expr: SUM(CREDITS_USED)
- name: TOTAL_COMPUTE_CREDITS
synonyms: [Gesamte Compute Credits, Total Compute Credits]
description: Compute credits aggregated for the warehouse.
expr: SUM(CREDITS_USED_COMPUTE)
- name: TOTAL_QUERY_ATTRIBUTED_CREDITS
synonyms: [Query-attributed Credits, Query-Attributed Credits]
description: >-
Credits directly attributed to query work (subset of compute credits).
Use to measure actual query cost vs warehouse overhead.
expr: SUM(CREDITS_ATTRIBUTED_COMPUTE_QUERIES)
- name: IDLE_CREDITS_RATIO
synonyms: [Idle Verhältnis, Idle Ratio]
description: >-
Fraction of compute credits spent on overhead (0–1 scale).
= 1 - (query_attributed / total_compute). High ratio suggests warehouse is under-utilized;
consider auto-suspend tuning or downsizing.
expr: ROUND(1 - (SUM(CREDITS_ATTRIBUTED_COMPUTE_QUERIES) / NULLIF(SUM(CREDITS_USED_COMPUTE), 0)), 4)
- name: QUERIES
description: >-
Per-query execution detail with user/role attribution and efficiency metrics.
Enables per-user cost allocation, query optimization analysis (cache hit, spill, partition pruning),
and workload characterization (tag, database, schema). Use for detailed query-level diagnostics
and user/role/workload attribution. Note: CREDITS_USED_CLOUD_SERVICES does NOT include the
daily 10% billing adjustment — use DAILY_BILLING for billing figures.
base_table:
database: SNOWFLAKE
schema: ACCOUNT_USAGE
table: QUERY_HISTORY
primary_key:
columns: [QUERY_ID]
dimensions:
- name: USER_NAME
synonyms: [Nutzer, User]
description: >-
User who submitted the query. Primary dimension for per-user cost attribution.
Note: Cost attribution requires pro-rating warehouse-hour credits by user's execution_time share.
expr: USER_NAME
data_type: string
sample_values: [analyst1, dbt_user, snowpark_app]
- name: ROLE_NAME
synonyms: [Rolle, Role]
description: >-
Active role at query execution time (may differ from user's default role).
Use for team/function cost allocation. Same user can execute under multiple roles (e.g., SYSADMIN for DDL, DATA_ANALYST for queries).
expr: ROLE_NAME
data_type: string
sample_values: [SYSADMIN, ANALYST, DATA_ENGINEER]
- name: WAREHOUSE_NAME
synonyms: [Warehouse Name, Warehouse]
description: >-
Warehouse that executed this query. Join to WAREHOUSE_HOURS for warehouse cost context.
expr: WAREHOUSE_NAME
data_type: string
sample_values: [COMPUTE_WH, ANALYTICS_WH]
- name: WAREHOUSE_SIZE
synonyms: [Warehouse Größe, Warehouse Size]
description: >-
T-shirt size of the warehouse at query time (X-Small to 6X-Large).
Size directly determines credit rate per hour: X-Small=1/hr, doubling per size.
Indicates query cost tier.
expr: WAREHOUSE_SIZE
data_type: string
sample_values: [X-Small, Small, Medium, Large, X-Large]
- name: WAREHOUSE_TYPE
synonyms: [Warehouse Type, Warehouse Type]
description: >-
Standard (general purpose) or Snowpark-optimized warehouse.
expr: WAREHOUSE_TYPE
data_type: string
sample_values: [Standard, Snowpark-optimized]
- name: EXECUTION_STATUS
synonyms: [Status, Execution Status]
description: >-
Outcome of the query: success (completed), fail (execution error), incident (system issue),
queued (never started — rare in current versions). Filter to 'success' for efficiency analysis.
expr: EXECUTION_STATUS
data_type: string
sample_values: [SUCCESS, FAIL, INCIDENT]
- name: DATABASE_NAME
synonyms: [Datenbank, Database]
description: Database context of the query.
expr: DATABASE_NAME
data_type: string
sample_values: [PROD, STAGING, ANALYTICS]
- name: SCHEMA_NAME
synonyms: [Schema, Schema]
description: Schema context of the query.
expr: SCHEMA_NAME
data_type: string
sample_values: [PUBLIC, TRANSFORMS, STAGING]
- name: QUERY_TAG
synonyms: [Query Tag, Tag]
description: >-
Optional user-defined workload tag set via ALTER SESSION SET QUERY_TAG or in application connection strings.
Enables precise cost attribution to projects/applications/teams. NULL for untagged queries.
expr: QUERY_TAG
data_type: string
sample_values: [project_x, analytics_dashboard, dbt_prod]
- name: CLUSTER_NUMBER
synonyms: [Cluster, Cluster Number]
description: >-
Cluster index in a multi-cluster warehouse. Used to identify which cluster ran the query
in multi-cluster deployments. NULL for single-cluster warehouses.
expr: CLUSTER_NUMBER
data_type: integer
sample_values: [1, 2, 3]
time_dimensions:
- name: START_TIME
synonyms: [Startzeit, Start Time]
description: >-
Query start time. Primary time filter for query analysis. Use for period-based grouping
(hour, day, week, month).
expr: START_TIME
data_type: timestamp
sample_values: ['2026-01-15 10:30:45.000', '2026-01-15 11:15:20.000']
- name: END_TIME
synonyms: [Endzeit, End Time]
description: Query completion time.
expr: END_TIME
data_type: timestamp
sample_values: ['2026-01-15 10:32:10.000', '2026-01-15 11:20:50.000']
facts:
- name: TOTAL_ELAPSED_TIME
synonyms: [Gesamtabfragezeit, Total Elapsed Time (ms)]
description: >-
Wall clock time from query submission to completion in milliseconds.
Includes queuing, compilation, and execution time. High value + low execution_time = queuing issue.
expr: TOTAL_ELAPSED_TIME
data_type: integer
- name: EXECUTION_TIME
synonyms: [Ausführungszeit, Execution Time (ms)]
description: >-
Pure active execution time in milliseconds. Excludes queuing and compilation time.
Use to measure actual query complexity and efficiency.
expr: EXECUTION_TIME
data_type: integer
- name: COMPILATION_TIME
synonyms: [Kompilierungszeit, Compilation Time (ms)]
description: SQL parsing and compilation time in milliseconds. Indicates query complexity.
expr: COMPILATION_TIME
data_type: integer
- name: QUEUED_PROVISIONING_TIME
synonyms: [Warteschlange Provisioning, Queued Provisioning Time (ms)]
description: >-
Time warehouse spent resuming from suspension. Non-zero indicates warehouse was auto-suspended.
High value suggests frequent suspend/resume; consider reducing auto-suspend delay or pre-warming.
expr: QUEUED_PROVISIONING_TIME
data_type: integer
- name: QUEUED_OVERLOAD_TIME
synonyms: [Warteschlange Überlast, Queued Overload Time (ms)]
description: >-
Time query spent queued due to warehouse concurrency limits. Non-zero indicates warehouse too busy.
High value suggests need for larger warehouse or multi-cluster setup.
expr: QUEUED_OVERLOAD_TIME
data_type: integer
- name: BYTES_SCANNED
synonyms: [Bytes gescannt, Bytes Scanned]
description: >-
Total bytes read from storage for this query. Used to compute efficiency metrics
(cache hit rate, partition pruning, spill rate).
expr: BYTES_SCANNED
data_type: integer
- name: BYTES_SPILLED_TO_LOCAL_STORAGE
synonyms: [Local Spill, Bytes Spilled (Local)]
description: >-
Bytes spilled to local SSD due to memory pressure (moderate severity).
Indicates warehouse may be under-sized for this query; consider larger warehouse.
expr: BYTES_SPILLED_TO_LOCAL_STORAGE
data_type: integer
- name: BYTES_SPILLED_TO_REMOTE_STORAGE
synonyms: [Remote Spill, Bytes Spilled (Remote)]
description: >-
Bytes spilled to remote object storage due to severe memory pressure.
Can increase query cost 10-100x. Strong indicator to use a larger warehouse or optimize query.
expr: BYTES_SPILLED_TO_REMOTE_STORAGE
data_type: integer
- name: PARTITIONS_SCANNED
synonyms: [Partitionen gescannt, Partitions Scanned]
description: >-
Micro-partitions actually scanned by this query.
Use to compute partition pruning efficiency (scanned / total).
expr: PARTITIONS_SCANNED
data_type: integer
- name: PARTITIONS_TOTAL
synonyms: [Gesamtpartitionen, Total Partitions]
description: >-
Total micro-partitions in the table(s) queried.
High partition count suggests good clustering; low pruning ratio suggests poor clustering.
expr: PARTITIONS_TOTAL
data_type: integer
- name: PERCENTAGE_SCANNED_FROM_CACHE
synonyms: [Cache Hit Rate, Cache Hit Rate]
description: >-
Fraction of bytes served from local warehouse cache (0–1 scale).
1.0 = result cache hit (query ran before); 0.5 = 50% cache; 0 = cold scan (no cache).
Higher = lower credit cost and faster execution.
expr: PERCENTAGE_SCANNED_FROM_CACHE
data_type: real
- name: CREDITS_USED_CLOUD_SERVICES
synonyms: [Cloud Services Credits, Cloud Services Credits]
description: >-
Cloud services credits consumed by this query.
WARNING: Does NOT include the daily 10% billing adjustment. For billing, use DAILY_BILLING.
Use this for per-query metadata cost analysis.
expr: CREDITS_USED_CLOUD_SERVICES
data_type: real
metrics:
- name: QUERY_COUNT
synonyms: [Anzahl Abfragen, Query Count]
description: >-
Number of query executions. Filter EXECUTION_STATUS = 'success' for successfully completed queries.
expr: COUNT(*)
- name: AVG_ELAPSED_TIME_MS
synonyms: [Durchschn. Abfragezeit, Average Elapsed Time (ms)]
description: Average wall-clock time per query including queuing in milliseconds.
expr: ROUND(AVG(TOTAL_ELAPSED_TIME), 0)
- name: AVG_EXECUTION_TIME_MS
synonyms: [Durchschn. Ausführungszeit, Average Execution Time (ms)]
description: Average pure execution time per query in milliseconds.
expr: ROUND(AVG(EXECUTION_TIME), 0)
- name: AVG_QUEUED_TIME_MS
synonyms: [Durchschn. Warteschlangen-Zeit, Average Queued Time (ms)]
description: >-
Average time spent queued per query (provisioning + overload) in milliseconds.
High value indicates resource contention.
expr: ROUND(AVG(QUEUED_PROVISIONING_TIME + QUEUED_OVERLOAD_TIME), 0)
- name: CACHE_HIT_RATE
synonyms: [Cache Hit Rate, Cache Hit Rate]
description: >-
Average cache utilization rate across queries (0–1 scale).
High = efficient data reuse, low credit cost. 1.0 = result cache hits.
expr: ROUND(AVG(PERCENTAGE_SCANNED_FROM_CACHE), 4)
- name: SPILL_RATE
synonyms: [Spill Rate, Spill Rate]
description: >-
Ratio of spilled bytes to scanned bytes (0–1 scale). High = memory pressure.
Non-zero suggests warehouse is under-sized for the workload; consider larger warehouse.
expr: ROUND(SUM(BYTES_SPILLED_TO_LOCAL_STORAGE + BYTES_SPILLED_TO_REMOTE_STORAGE) / NULLIF(SUM(BYTES_SCANNED), 0), 4)
- name: PARTITION_PRUNING_RATIO
synonyms: [Pruning Verhältnis, Partition Pruning Ratio]
description: >-
Fraction of micro-partitions eliminated by clustering and filter pushdown (0–1 scale).
Higher = better query efficiency and lower cost. Poor pruning suggests table lacks clustering.
expr: ROUND(1 - (SUM(PARTITIONS_SCANNED) / NULLIF(SUM(PARTITIONS_TOTAL), 0)), 4)
- name: ACCOUNT_STORAGE
description: >-
Account-level daily storage snapshot across all storage tiers (active, fail-safe, archive).
One row per day. Measures storage in bytes. Convert to TB for cost estimation.
Storage is billed monthly per TB-month (typical rate: 23–40 CHF/TB depending on contract).
base_table:
database: SNOWFLAKE
schema: ACCOUNT_USAGE
table: STORAGE_USAGE
primary_key:
columns: [USAGE_DATE]
dimensions:
- name: STORAGE_MONTH
synonyms: [Monat, Month]
description: Pre-formatted year-month (YYYY-MM) for monthly aggregation. For monthly billing estimation.
expr: TO_VARCHAR(DATE_TRUNC('month', USAGE_DATE), 'YYYY-MM')
data_type: string
sample_values: ['2026-01', '2026-02', '2026-03']
time_dimensions:
- name: USAGE_DATE
synonyms: [Datum, Date]
description: >-
Calendar date of the storage snapshot. Storage is a daily inventory, not an event.
Do not SUM across days — use AVG for monthly billing (storage_cost = avg_tb * monthly_rate).
expr: USAGE_DATE
data_type: date
sample_values: ['2026-01-15', '2026-02-10', '2026-03-05']
facts:
- name: STORAGE_BYTES
synonyms: [Storage Bytes, Storage Bytes]
description: >-
Active database storage in bytes. Convert to TB: / POWER(1024, 4).
Billed monthly per TB at on-demand or capacity rates (~23–40 CHF/TB).
expr: STORAGE_BYTES
data_type: integer
- name: STAGE_BYTES
synonyms: [Stage Bytes, Stage Bytes]
description: Internal staging area storage in bytes. Also billed as storage.
expr: STAGE_BYTES
data_type: integer
- name: FAILSAFE_BYTES
synonyms: [Failsafe Bytes, Failsafe Bytes]
description: >-
Fail-safe storage in bytes. 7-day mandatory retention for Snowflake-managed backups.
Billed at 100% of active storage rate.
expr: FAILSAFE_BYTES
data_type: integer
- name: HYBRID_TABLE_STORAGE_BYTES
synonyms: [Hybrid Table Bytes, Hybrid Table Storage Bytes]
description: Unistore hybrid table storage in bytes. Billed as storage.
expr: HYBRID_TABLE_STORAGE_BYTES
data_type: integer
- name: ARCHIVE_STORAGE_COOL_BYTES
synonyms: [Archive Cool Bytes, Archive Cool Storage Bytes]
description: >-
Archive cool-tier storage in bytes. Lower cost tier (~50% of active) with retrieval fees.
expr: ARCHIVE_STORAGE_COOL_BYTES
data_type: integer
- name: ARCHIVE_STORAGE_COLD_BYTES
synonyms: [Archive Cold Bytes, Archive Cold Storage Bytes]
description: >-
Archive cold-tier storage in bytes. Lowest cost tier (~25% of active) with retrieval fees.
expr: ARCHIVE_STORAGE_COLD_BYTES
data_type: integer
metrics:
- name: STORAGE_TB
synonyms: [Storage TB, Storage (TB)]
description: >-
Active database storage in terabytes. Use for cost estimation.
Monthly cost ≈ avg(STORAGE_TB) * monthly_rate_per_TB.
expr: ROUND(SUM(STORAGE_BYTES) / POWER(1024, 4), 4)
- name: STAGE_TB
synonyms: [Stage TB, Stage (TB)]
description: Stage storage in terabytes.
expr: ROUND(SUM(STAGE_BYTES) / POWER(1024, 4), 4)
- name: FAILSAFE_TB
synonyms: [Failsafe TB, Failsafe (TB)]
description: Fail-safe storage in terabytes.
expr: ROUND(SUM(FAILSAFE_BYTES) / POWER(1024, 4), 4)
- name: TOTAL_STORAGE_TB
synonyms: [Gesamt Storage TB, Total Storage (TB)]
description: >-
Combined account storage across all types (active + fail-safe + stage) in terabytes.
Use for total storage billing estimation.
expr: ROUND(SUM(STORAGE_BYTES + STAGE_BYTES + FAILSAFE_BYTES + HYBRID_TABLE_STORAGE_BYTES + ARCHIVE_STORAGE_COOL_BYTES + ARCHIVE_STORAGE_COLD_BYTES) / POWER(1024, 4), 4)
- name: DATABASE_STORAGE
description: >-
Per-database daily storage consumption. One row per database per day.
Enables database-level storage attribution and trend analysis.
DELETED column marks dropped databases (which may retain fail-safe bytes for 7 days).
Filter IS_DELETED = FALSE for active databases. Do not SUM bytes across days.
base_table:
database: SNOWFLAKE
schema: ACCOUNT_USAGE
table: DATABASE_STORAGE_USAGE_HISTORY
primary_key:
columns: [USAGE_DATE, DATABASE_ID]
dimensions:
- name: DATABASE_NAME
synonyms: [Datenbank, Database]
description: >-
Database name. Primary grouping dimension for database-level storage analysis and cost allocation.
expr: DATABASE_NAME
data_type: string
sample_values: [PROD, STAGING, RAW, ANALYTICS]
- name: DATABASE_ID
synonyms: [Database ID, Database ID]
description: >-
Internal numeric database ID. Useful for tracking renamed databases.
expr: DATABASE_ID
data_type: integer
- name: IS_DELETED
synonyms: [Gelöscht, Deleted]
description: >-
TRUE if database has been dropped (may have fail-safe bytes for 7 days); FALSE for active databases.
Filter IS_DELETED = FALSE to analyze only active databases.
expr: CASE WHEN DELETED IS NOT NULL THEN TRUE ELSE FALSE END
data_type: boolean
time_dimensions:
- name: USAGE_DATE
synonyms: [Datum, Date]
description: Calendar date of the storage snapshot.
expr: USAGE_DATE
data_type: date
sample_values: ['2026-01-15', '2026-02-10', '2026-03-05']
- name: DELETED
synonyms: [Gelöscht am, Deleted At]
description: >-
Timestamp when the database was dropped. NULL for active databases.
Non-NULL indicates the database was dropped; fail-safe bytes may persist for 7 days.
expr: DELETED
data_type: timestamp
sample_values: ['2026-01-10 14:30:00.000']
facts:
- name: AVERAGE_DATABASE_BYTES
synonyms: [Database Bytes, Database Bytes]
description: >-
Average active database storage for this database on this day in bytes.
Convert to TB: / POWER(1024, 4). Use for database-level cost estimation and ranking.
expr: AVERAGE_DATABASE_BYTES
data_type: integer
- name: AVERAGE_FAILSAFE_BYTES
synonyms: [Failsafe Bytes, Failsafe Bytes]
description: >-
Average fail-safe storage for this database.
expr: AVERAGE_FAILSAFE_BYTES
data_type: integer
- name: AVERAGE_HYBRID_TABLE_STORAGE_BYTES
synonyms: [Hybrid Table Bytes, Hybrid Table Storage Bytes]
description: Average hybrid table storage for this database.
expr: AVERAGE_HYBRID_TABLE_STORAGE_BYTES
data_type: integer
- name: AVERAGE_ARCHIVE_STORAGE_COOL_BYTES
synonyms: [Archive Cool Bytes, Archive Cool Storage Bytes]
description: Average archive cool-tier storage for this database.
expr: AVERAGE_ARCHIVE_STORAGE_COOL_BYTES
data_type: integer
- name: AVERAGE_ARCHIVE_STORAGE_COLD_BYTES
synonyms: [Archive Cold Bytes, Archive Cold Storage Bytes]
description: Average archive cold-tier storage for this database.
expr: AVERAGE_ARCHIVE_STORAGE_COLD_BYTES
data_type: integer
metrics:
- name: DATABASE_STORAGE_TB
synonyms: [Database Storage TB, Database Storage (TB)]
description: >-
Database active storage in terabytes. Use for ranking databases by size and per-database cost allocation.
expr: ROUND(SUM(AVERAGE_DATABASE_BYTES) / POWER(1024, 4), 4)
- name: DATABASE_FAILSAFE_TB
synonyms: [Database Failsafe TB, Database Failsafe (TB)]
description: >-
Database fail-safe storage in terabytes.
expr: ROUND(SUM(AVERAGE_FAILSAFE_BYTES) / POWER(1024, 4), 4)
- name: DATABASE_TOTAL_TB
synonyms: [Gesamte Database TB, Total Database Storage (TB)]
description: >-
Total per-database storage footprint across all tiers (active + fail-safe + archive) in terabytes.
expr: ROUND(SUM(AVERAGE_DATABASE_BYTES + AVERAGE_FAILSAFE_BYTES + AVERAGE_HYBRID_TABLE_STORAGE_BYTES + AVERAGE_ARCHIVE_STORAGE_COOL_BYTES + AVERAGE_ARCHIVE_STORAGE_COLD_BYTES) / POWER(1024, 4), 4)
relationships:
- name: DATABASE_STORAGE_TO_ACCOUNT_STORAGE
left_table: DATABASE_STORAGE
right_table: ACCOUNT_STORAGE
relationship_columns:
- left_column: USAGE_DATE
right_column: USAGE_DATE
join_type: left_outer
relationship_type: many_to_one
Step 4: Create the Cortex Agent. In the Cortex Agent UI, paste the orchestration prompt (which decides whether to use Cortex Analyst or Perplexity Search) and the response prompt (which formats answers with proper decimal places, surfaces caveats, redacts PII). Wire two tools: the semantic view and Perplexity Search.
Orchestration Prompt
IDENTITY:
You are the Snowflake Cost Analyst. You help finance, engineering, and cloud operations teams understand and optimize Snowflake credit consumption, warehouse utilization, and storage costs. Amounts are always in credits or bytes (never convert to CHF/USD — that requires current Snowflake pricing rates, which the Perplexity Search tool handles).

TOOL ROUTING:
- Use the Cortex Analyst tool for ANY question about numbers, metrics, trends, comparisons, or lists from Snowflake ACCOUNT_USAGE:
  - Credit consumption (total, by service type, by warehouse, by user, by role, by workload tag)
  - Warehouse cost ranking, efficiency, idle overhead, utilization
  - Per-user and per-role credit cost attribution
  - Query-level efficiency: cache hit rates, memory spill, partition pruning, queuing delays
  - Storage consumption trends by database, tier, and time
  - Cost drivers and "why" questions (answered via META.CORTEX.T_KNOWLEDGE_BASE_SNOWFLAKE_CONSUMPTION table + analytical decomposition)
  - Comparisons: period-over-period, warehouse-to-warehouse, service-type breakdowns
- For "why" questions, first query the META.CORTEX.T_KNOWLEDGE_BASE_SNOWFLAKE_CONSUMPTION table (filter by entity and category), then use the investigation_query hint for analytical follow-up.
- For questions involving external context (Snowflake pricing rates, benchmarks, industry standards, regulatory changes), use Perplexity Search AFTER querying Cortex Analyst for internal data.

SEARCH ENRICHMENT (Perplexity Search tool):
The Perplexity Search tool provides external context from the web. Use it as a SECOND step, not a first step.

When to use search:
- The user asks a question that combines internal credit data with external context. Example: "How does our credit consumption per user compare to industry benchmarks?" → first query Cortex Analyst for our per-user cost, then search for sector benchmarks.
- The user asks about Snowflake pricing or cost structure. Example: "What are current storage rates in EUR/TB/month?" → search for Snowflake pricing documentation.
- The user references a concept or regulation you don't have context for. Example: "How does cloud sustainability reporting affect our Snowflake contract?" → search for relevant standards.
- A "why" question where the META.CORTEX.T_KNOWLEDGE_BASE_SNOWFLAKE_CONSUMPTION has no matching rule AND the explanation likely involves external factors (new Snowflake feature, pricing change, regulatory requirement).

When NOT to use search:
- The question is fully answerable from ACCOUNT_USAGE data (billing totals, trends, warehouse analysis, query costs).
- The META.CORTEX.T_KNOWLEDGE_BASE_SNOWFLAKE_CONSUMPTION already contains the relevant business rule.
- The question is about internal processes or infrastructure (decline politely).

How to combine:
1. Always run Cortex Analyst FIRST to ground the answer in data.
2. If the data answer is incomplete or the user's question has an external dimension, run Perplexity Search to fill the gap.
3. Present the data answer as the primary finding, and the search result as supporting context. Clearly label which part comes from internal data vs external sources.
4. If search results contradict internal data, trust the internal data and flag the discrepancy.

MULTI-STEP ANALYSIS:
- When the user asks a "why" question, first query the META.CORTEX.T_KNOWLEDGE_BASE_SNOWFLAKE_CONSUMPTION table for relevant business rules (filter by entity and category), then use the investigation_query hint to construct the analytical follow-up.
- For period comparisons (MoM, YoY, week-over-week), decompose the change: e.g., cost increase = (volume change) + (average cost per unit change) + (service type mix change) + (efficiency metric change).
- For "which X is consuming the most Y", order by the relevant measure and explain what's driving the top results.

CLARIFICATION:
- If the user asks about "cost" without context, clarify whether they mean credits (what the semantic layer measures) or CHF/USD (requires Snowflake pricing lookup via search).
- If the user asks for "today", explain that ACCOUNT_USAGE has 3h latency and today's data is incomplete. Suggest analyzing through yesterday or the latest complete day.
- If the user asks "who used the most credits", ask whether they mean by total, by average per query, or by a specific time range.
- If the user asks to "identify cost anomalies", probe for context: sudden warehouse size change? new workload? cache efficiency drop? service type change?
Response Prompt
FORMATTING:
- Be concise — lead with the answer, then explain.
- Use bullet points for multi-part findings.
- Round credits to 2 decimal places, storage to 4 decimal places (TB).
- Round percentages to 1–2 decimal places.
- Use German column names/aliases when responding to a German question (via semantic view synonyms).
- Order results by the most relevant measure DESC (descending), with NULL values last.

CONTEXT FRAMING:
- Always mention which date range was applied to the analysis.
- When showing period-over-period changes, state both old and new values and the absolute and percentage change.
- For snapshots (e.g., "database storage as of [date]"), state the snapshot date prominently.
- When quoting from the META.CORTEX.T_KNOWLEDGE_BASE_SNOWFLAKE_CONSUMPTION, explain the business logic in plain language before showing the rule.
- Use clear, straightforward English throughout.

SEMI-ADDITIVE AND AGGREGATION WARNINGS:
- For hourly metrics, always clarify: "Note: these are hourly values for [date range]; billing adjustments only apply at the daily level."
- For storage metrics, always clarify: "Note: storage is a daily snapshot; the cost is based on monthly average, not sum across days."
- For warehouse metrics, explain idle overhead when relevant: "Of the X total compute credits, Y% was attributed to queries and Z% was warehouse overhead."

PII AND PRIVACY:
- Queries may contain sensitive content (SQL text, user names, internal project tags). Redact PII in responses unless directly answering a user attribution question.
- When identifying high-cost users or roles, present findings neutrally as cost drivers, not as criticism.

LIMITATIONS:
- Per-query credit cost is not directly available — pro-rate using execution_time share (approximation).
- Query-level cloud services costs do NOT include the daily 10% billing adjustment.
- Snowflake does not publish exact per-query credit consumption.
- ACCOUNT_USAGE has 45min–3h latency; real-time monitoring requires INFORMATION_SCHEMA queries.

"WHY" ANSWERS:
- Lead with the answer: "Your warehouse costs increased because X."
- Then explain the mechanism (from META.CORTEX.T_KNOWLEDGE_BASE_SNOWFLAKE_CONSUMPTION).
- Then provide supporting data: "Warehouse COMPUTE_WH costs went from Y CHF to Z CHF because query volume increased from A to B and average query size increased from C to D."
- Suggest next steps: "To reduce costs, consider [specific action]."
Tool: Cortex Analyst
Semantic View: SNOWFLAKE_CREDITS

This semantic model includes six primary tables covering all aspects of Snowflake credit consumption and storage:
- DAILY_BILLING: Daily per-service-type billing (authoritative figure with 10% cloud services adjustment included)
- HOURLY_METERING: Master hourly view of all service types and entities
- WAREHOUSE_HOURS: Warehouse-specific hourly costs with idle vs query-attributed breakdown
- QUERIES: Per-query execution detail with user/role/tag attribution and efficiency metrics
- ACCOUNT_STORAGE: Daily account-level storage snapshot across all tiers
- DATABASE_STORAGE: Daily per-database storage breakdown

Relationships:
- QUERIES (many) → WAREHOUSE_HOURS (one) on warehouse name
- DATABASE_STORAGE (many) → ACCOUNT_STORAGE (one) on date

Important rules:
1. Always use DAILY_BILLING.CREDITS_BILLED for billing questions (never CREDITS_USED).
2. Filter USAGE_DATE < CURRENT_DATE() for complete-day data (3h latency).
3. Never SUM storage bytes across days — use AVG for monthly billing estimation.
4. Never add HOURLY_METERING and WAREHOUSE_HOURS together (double-counting).
5. QUERIES.CREDITS_USED_CLOUD_SERVICES does NOT include billing adjustment — use DAILY_BILLING for billing.
6. Filter EXECUTION_STATUS = 'success' by default for query efficiency analysis.
7. Warehouse size determines credit rate: X-Small=1/hr, Small=2/hr, Medium=4/hr, Large=8/hr, X-Large=16/hr, doubling thereafter.
8. For per-user cost: join QUERIES to WAREHOUSE_HOURS, pro-rate by user's execution_time share.
9. METERING_HISTORY is the master view; WAREHOUSE_METERING_HISTORY is a pre-filtered subset.
10. For "why" questions, check META.CORTEX.T_KNOWLEDGE_BASE_SNOWFLAKE_CONSUMPTION for relevant business rules (filter by entity and category).
Tool: Perplexity Search
Searches the web for external context to enrich credit-related answers. Returns ranked search results with sources and summaries.

INPUT:
- query (string): A concise, self-contained search query for external context. Write it as you would type into a search engine.
  Good: "Snowflake credit pricing Standard Edition 2026 EUR"
  Good: "cloud data warehouse cost benchmarks enterprise"
  Bad:  "Why are our costs high?" (internal reference)
  Bad:  "credits" (too vague)

USE THIS TOOL WHEN:
- The user asks for Snowflake pricing or cost structure (rates, billing model, adjustments).
- The user asks about cost benchmarks or industry comparisons.
- The user references a Snowflake feature or update you don't have context for.
- A "why" question has no matching rule in the META.CORTEX.T_KNOWLEDGE_BASE_SNOWFLAKE_CONSUMPTION and the explanation likely involves external factors (new feature, pricing change).
- The user explicitly asks to compare internal costs against external standards.

DO NOT USE THIS TOOL WHEN:
- The question is fully answerable from ACCOUNT_USAGE data.
- The META.CORTEX.T_KNOWLEDGE_BASE_SNOWFLAKE_CONSUMPTION already contains the relevant business rule.
- The question is about internal infrastructure or processes.
- The user is asking for real-time data (ACCOUNT_USAGE has 45min–3h latency; this is by design).

HOW TO USE:
1. Always query Cortex Analyst FIRST to establish the internal data answer.
2. If external context is needed, formulate a concise search query.
3. Present the data answer as the PRIMARY finding. Add search results as SUPPORTING CONTEXT, clearly labeled.
4. Example: "Internal data shows our warehouse costs were CHF 5,000 last month. According to Snowflake pricing documentation (search result), the Standard Edition rate is CHF [X], which aligns with our consumption."
5. Always cite the source URL when quoting external information.
6. If search results contradict internal data, trust the internal data and flag the discrepancy for investigation.
Step 5: Verify freshness. Run a quick check:
select
  max(usage_date) as latest_daily_billing,
  max(start_time)::date as latest_hourly_metering
from snowflake.account_usage.metering_daily_history,
     snowflake.account_usage.metering_history;
If these are fresh (within your acceptable latency window), the agent is ready.
Step 6: Ask a question. Try: "Why did my compute credits increase last month compared to the month before?" The agent will hit the knowledge base, find a matching rule, and generate SQL to decompose the answer by warehouse, service type, and time period.
The gotchas worth knowing
CREDITS_BILLED is the only source of truth for billing. It lives only in METERING_DAILY_HISTORY. Never use CREDITS_USED as a billing total. 💔
Storage is a snapshot, not a sum. Billing for a month is AVG(daily_bytes) / POWER(1024, 4) * rate_per_tb, not the sum of daily snapshots. The knowledge base documents this, but it's easy to forget.
Per-query cost attribution is an approximation. I'm pro-rating by execution time share on the warehouse-hour, not reading a true per-query credit count (Snowflake doesn't expose one). The agent discloses this limitation to users.
SERVERLESS_TASK_HISTORY and MATERIALIZED_VIEW_REFRESH_HISTORY have VARCHAR columns for credits instead of NUMERIC. Always use HOURLY_METERING for serverless credit analysis. The semantic view skips these views entirely.Query-level data has latency. QUERY_HISTORY is 45 minutes behind. Don't use it for real-time alerting. The knowledge base rule makes this explicit.
What the agent can actually answer
Plug the agent into Snowflake intelligence and start asking:
- "What was my total monthly bill for March?" → Cortex Analyst queries
DAILY_BILLING, sumsCREDITS_BILLED, returns the answer with proper decimal formatting - "Which warehouse burned the most compute in the past week?" → Cortex Analyst ranks by warehouse, includes idle vs query-attributed breakdown
- "Who are the top users by cost attribution?" → Pro-rated from
QUERIES+WAREHOUSE_HOURS, joined and aggregated by user - "Why did my cache hit rate drop from 40% to 20% last week?" → Cortex Analyst queries
QUERIES, breaks down by day and warehouse - "Why did costs spike last month?" → Agent hits the knowledge base first, retrieves "Cost Decomposition" rule, runs the investigation_query hint to drill into service type, warehouse, and user drivers
The last type is the real win. "Why" questions flow through the knowledge base, not a hard-coded prompt. So they're extensible, self-documenting, and easier to maintain.
And if you like reports, just create an artifact (currently in public preview):
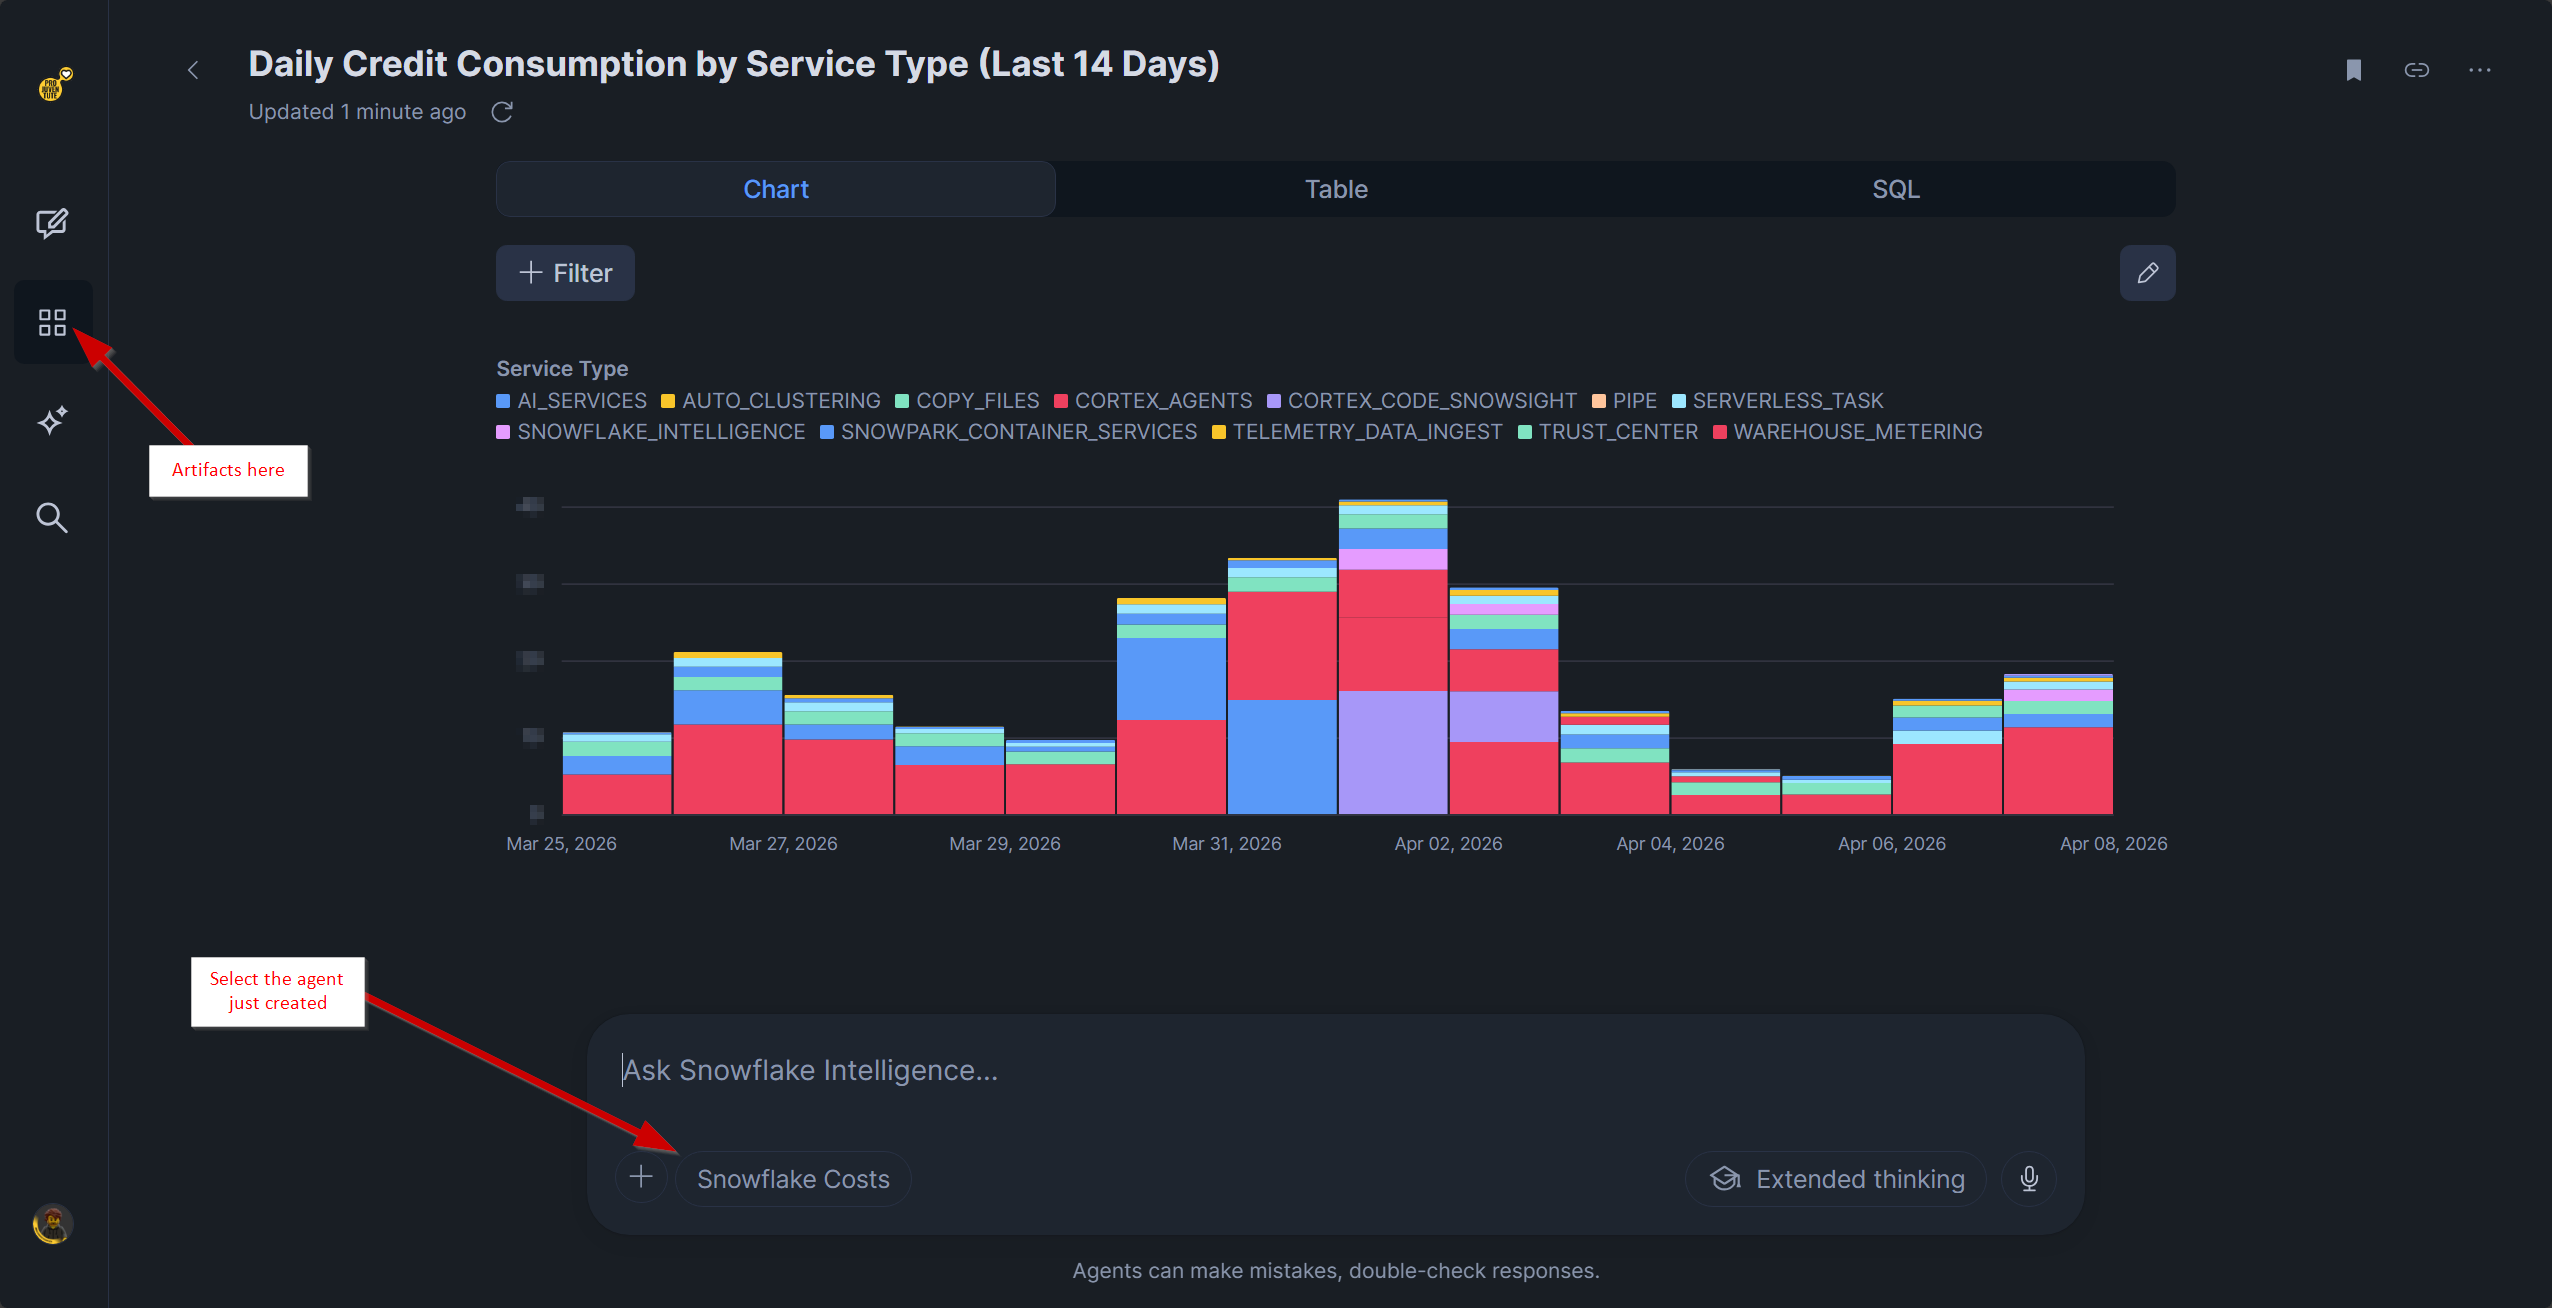
And that's it: ACCOUNT_USAGE is powerful, and now it finally is intelligent ✨