
Your coding agent keeps a diary
Every opencode session leaves a trail in a local SQLite file. dlt turns it into analytics you actually read.


TL/DR: OpenCode writes every session, message, and token count to a local SQLite file. A small dlt pipeline moves that into DuckDB, and a marimo notebook tells me what my AI habit actually costs.
On Monday, 2026-07-06, Alena Astrakhantseva and Alexey Grigorev did a DataTalksClub session on ingesting agent traces with dlt: pulling the structured logs an AI agent emits into a local DuckDB or cloud lakehouse so you can query them. They pulled from local Claude JSON files and a hosted traces API. My coding agent doesn't have a usage API, but it also keeps a diary on disk. Why not point dlt at that?
Where OpenCode hides its traces
OpenCode is my terminal coding agent.
 Martin Seifert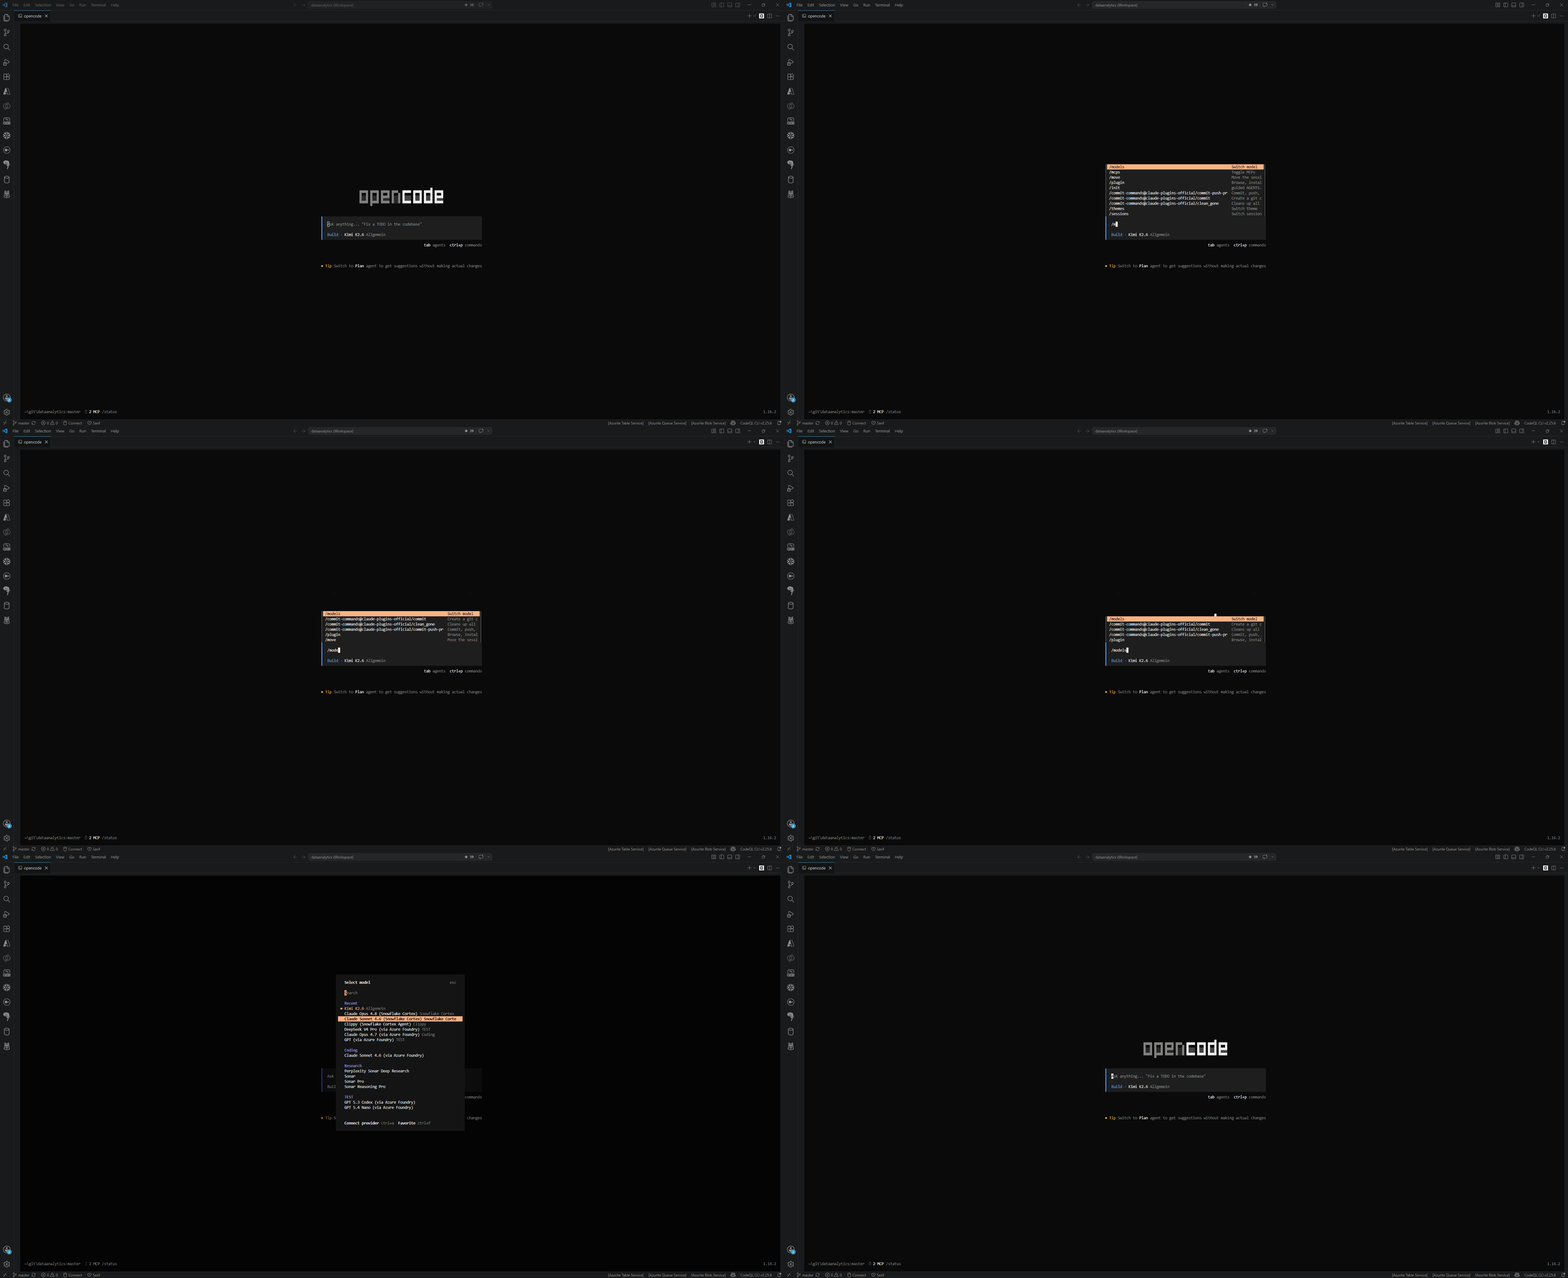
It stores metadata in a local SQLite database, on Windows at %LOCALAPPDATA%/opencode/opencode.db. Four tables carry the interesting stuff:
session: one row per session: title, model, agent, tokens, cost, timestampsmessage: one row per message, with adataJSON blobpart: one row per message part (tool calls, text, reasoning)todo: the agent's own todo items per session
That looks like a trace: Every prompt, every tool call, every token billed. It just sits there in a format nobody wants to query by hand 😅
The pipeline
The whole thing is a dlt source with four resources, one per table, using a small factory _t because sql_table sources don't accept source-level defaults without a @dlt.resource() wrapper (which I don't really need for this small pipeline):
@dlt.source(name="opencode_logs")
def opencode_logs_source(db_path: str = DB_PATH):
    credentials = f"sqlite:///{db_path}"

    def _t(name: str, primary_key):
        return sql_table(
            credentials=credentials,
            table=name,
            write_disposition="replace",
            primary_key=primary_key,
        )

    yield _t("session", "id")
    yield _t("message", "id")
    yield _t("part", "id")
    yield _t("todo", ("session_id", "position"))
Each table becomes a dlt resource with write_disposition="replace". Every run is a full refresh: no incremental bookkeeping, no state to corrupt. For a local log I regenerate on demand, replace is the honest choice.
Then point the pipeline at a DuckDB file and run:
pipeline = dlt.pipeline(
    pipeline_name="opencode_logs",
    destination=dlt.destinations.duckdb(DUCKDB_PATH),
    dataset_name="logs",
)

load_info = pipeline.run(opencode_logs_source())
Why dlt instead of the DuckDB extension sqlite? Because dlt handles schema inference, type coercion, and the SQLite-to-DuckDB hop for free. I describe four tables, dlt deals with the plumbing. When opencode adds a column in the next release, the pipeline picks it up without me touching the code.
What the traces say
With the data in DuckDB, a marimo notebook reads it directly. marimo is a reactive Python notebook: change a filter, every dependent cell recomputes. The connection is read-only, so the dashboard can never corrupt the load:
con = duckdb.connect(db_path, read_only=True)
raw_session = con.execute(
    """
    SELECT id, title, agent, model,
           time_created, cost,
           tokens_input, tokens_output,
           tokens_cache_read, tokens_cache_write
    FROM logs.session
    WHERE time_created IS NOT NULL
    """
).df()
From there the KPIs write themselves: total cost, session count, input vs output tokens, and cache-read share. Cached tokens are far cheaper than fresh input, so the higher that share, the less each session costs me:
cache_pct = (
    100.0 * total_cache_r / (total_input + total_cache_r)
    if (total_input + total_cache_r) > 0
    else 0.0
)
The charts cover daily cost, a stacked daily token mix (input, cache read, cache write, output), sessions-and-tokens on a dual axis, top models by cost, and the top 15 sessions by cost. That last one is the guilty-pleasure table: which single conversation burned the most money? And was it worth it?
Why bother tracing my own agent
Two reasons. The obvious one is cost: an AI coding agent bills per token, and without a dashboard I have no idea whether last week cost five dollars or fifty. The second is behavioural. The part and todo tables record how the agent actually worked: which tools it reached for, how it broke tasks down, where it looped: you cannot improve what you cannot see.
The difference to Alena's and Alexey's session on Monday is scale: They built for a hosted, multi-user traces API, I built for one developer (me) and one SQLite file. The dlt pipeline barely changes between the two. Swap the source, keep the resources, pick a destination. That's the point of dlt 😜
The full dlt pipeline:
# → ad-hoc: load the local OpenCode SQLite log into DuckDB for analysis
"""
dlt pipeline: OpenCode logs (SQLite at $LOCALAPPDATA/opencode.db) → DuckDB

Loads the four user-relevant tables from the OpenCode local metadata DB into a
local DuckDB file for offline analysis (token usage, session history, todos).

Tables loaded:
- session  — one row per session (title, model, agent, tokens, cost, time_created)
- message  — one row per message (session_id, time_created, data JSON)
- part     — one row per message part (message_id, session_id, data JSON)
- todo     — one row per todo item (session_id, content, status, position)

Data flow:
    $LOCALAPPDATA/opencode.db (SQLite) → dlt sql_database (sqlalchemy) → ./opencode_logs.duckdb

Lives in `dlt/local/` because the OpenCode SQLite DB is only on the developer's
machine, so this pipeline cannot run on dltHub Runtime. Run from any venv that
has `dlt[sql-database,duckdb]` installed (the dltHub venv at `dlt/dltHub/.venv`
works).
"""
import os

import dlt
from dlt.sources.sql_database import sql_table


# ---------------------------------------------------------------------------
# Config
# ---------------------------------------------------------------------------
# OpenCode stores its DB under %LOCALAPPDATA% on Windows.
# Override via env var OPENCODE_DB if you sync between machines.
DEFAULT_DB = os.path.join(
    os.environ.get("LOCALAPPDATA", os.path.expanduser("~")),
    "opencode",
    "opencode.db",
)
DB_PATH = os.environ.get("OPENCODE_DB", DEFAULT_DB)
DUCKDB_PATH = os.environ.get(
    "OPENCODE_DUCKDB_PATH",
    os.path.join(os.path.dirname(os.path.abspath(__file__)), "opencode_logs.duckdb"),
)


# ---------------------------------------------------------------------------
# dlt source
# ---------------------------------------------------------------------------
@dlt.source(name="opencode_logs")
def opencode_logs_source(db_path: str = DB_PATH):
    if not os.path.exists(db_path):
        raise FileNotFoundError(
            f"opencode SQLite DB not found at {db_path}. "
            f"Set OPENCODE_DB env var to override."
        )

    credentials = f"sqlite:///{db_path}"

    # sql_table streams via SQLAlchemy fetchmany in chunks of `chunk_size` (50k
    # by default), so memory stays flat regardless of source size.
    def _t(name: str, primary_key):
        return sql_table(
            credentials=credentials,
            table=name,
            write_disposition="replace",
            primary_key=primary_key,
        )

    yield _t("session", "id")
    yield _t("message", "id")
    yield _t("part", "id")
    yield _t("todo", ("session_id", "position"))


# ---------------------------------------------------------------------------
# Main
# ---------------------------------------------------------------------------
def load_opencode_logs() -> None:
    pipeline = dlt.pipeline(
        pipeline_name="opencode_logs",
        destination=dlt.destinations.duckdb(DUCKDB_PATH),
        dataset_name="logs",
    )
    print(f"Source: {DB_PATH}", flush=True)
    print(f"Destination: {DUCKDB_PATH}", flush=True)

    load_info = pipeline.run(opencode_logs_source())
    print(load_info)

    with pipeline.sql_client() as client:
        print("\nRow counts:", flush=True)
        for t in ("session", "message", "part", "todo"):
            try:
                with client.execute_query(f'SELECT count(*) FROM "{t}"') as cur:
                    n = cur.fetchone()[0]
                    print(f"  {t}: {n:,}")
            except Exception as e:
                print(f"  {t}: ERROR {e}")
    print("Done.", flush=True)


if __name__ == "__main__":
    load_opencode_logs()
For the marimo dashboard, ask you agent to build it for you 😎